Transwestern’s first quarter national office report confirmed the general opinion that the U.S. office market remains strong, with overall vacancy holding steady at 9.8%. National average asking rents nudged higher during the quarter to $26.63 per square foot, reflecting a 4.1% annual growth rate that exceeded the five-year compound annual average (CAGR) of 3.4%.
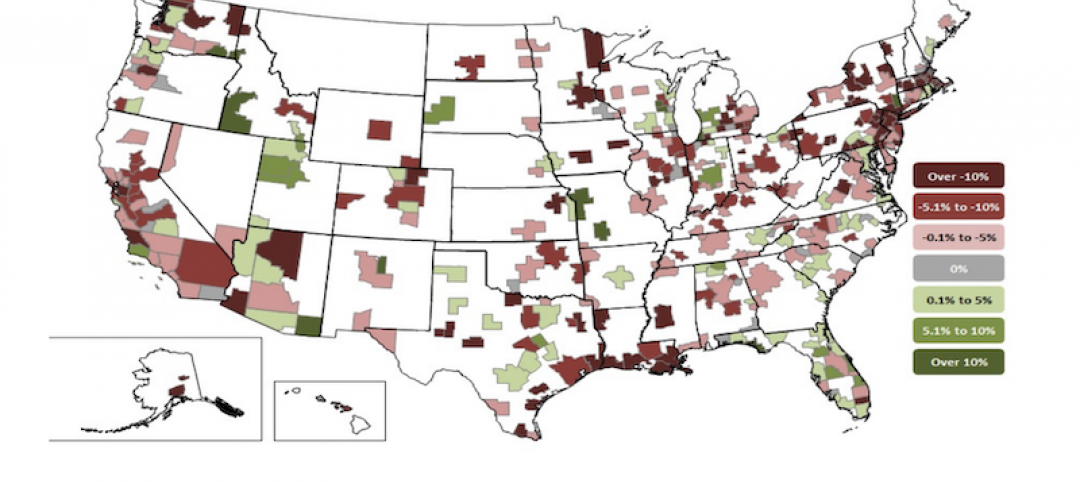
Of the 49 U.S. markets tracked by Transwestern, 45 reported positive rent growth, with 24 of those recording rates above 3.0%. The leaders in rent growth included Minneapolis; San Francisco; San Jose, California; Nashville, Tennessee; Raleigh/Durham, North Carolina; Tampa, Florida; Pittsburgh; California’s Inland Empire; Manhattan; and Charlotte, North Carolina.
“The U.S. economy grew 3.2% in the first quarter, the highest first-quarter growth in four years,” said Ryan Tharp, Research Director in Dallas. “That said, we are closely watching how factors such as U.S. trade conditions might impact the domestic economy in the remainder of 2019.”
Overall office leasing activity in the U.S. has slowed since 2016 but still ended the first quarter 1.5 million square feet higher than a year ago. Net absorption fell to 10.9 million square feet, with sublet space recording negative growth of 1.6 million square feet.
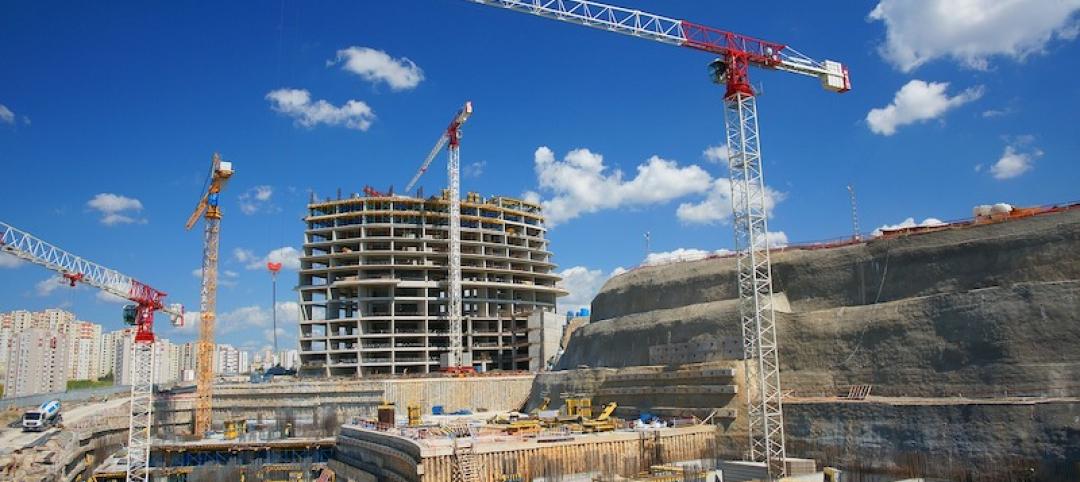
Construction activity jumped 9.7% during the past year, the highest level in the current cycle, but rising land and construction costs and labor challenges continue to limit new building deliveries and stave off systemic overbuilding that undermined some previous cycles.
“Solid fundamentals and adequate debt and equity capital bode well for continued, healthy performance in the office sector and cap rates remain at historic lows,” Tharp said. “We expect asking rents to settle at an annual rate of growth between 3.0% and 3.5% by the end of the year.”
Download the full National Office Market Report at: http://twurls.com/1q19-us-office
Related Stories
Market Data | Sep 20, 2021
August construction employment lags pre-pandemic peak in 39 states
The coronavirus delta variant and supply problems hold back recovery.
Market Data | Sep 15, 2021
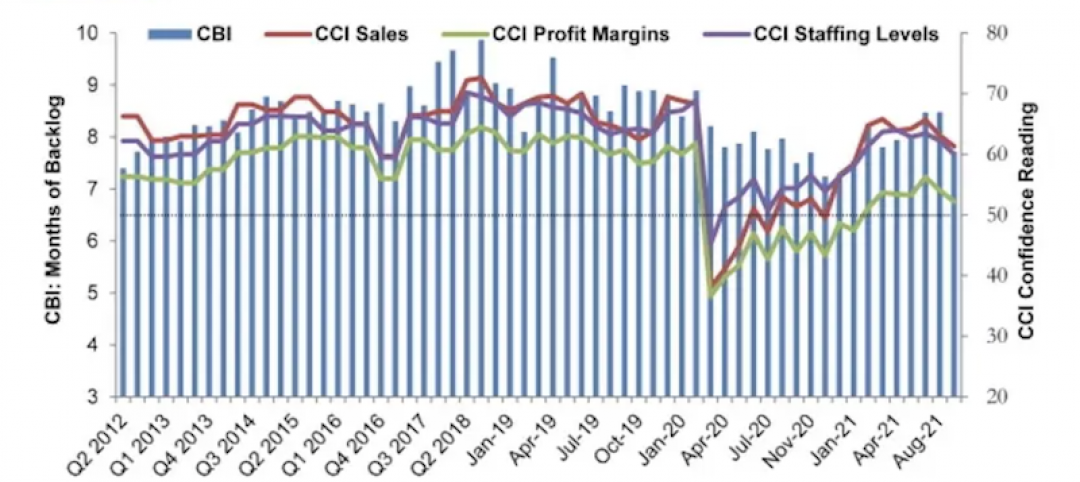
ABC’s Construction Backlog Indicator plummets in August; Contractor Confidence down
ABC’s Construction Confidence Index readings for sales, profit margins and staffing levels all fell modestly in August.
Market Data | Sep 7, 2021
Construction sheds 3,000 jobs in August
Gains are limited to homebuilding as other contractors struggle to fill both craft and salaried positions.
Market Data | Sep 3, 2021
Construction workforce shortages reach pre-pandemic levels
Coronavirus continues to impact projects and disrupt supply chains.
Multifamily Housing | Sep 1, 2021
Top 10 outdoor amenities at multifamily housing developments for 2021
Fire pits, lounge areas, and covered parking are the most common outdoor amenities at multifamily housing developments, according to new research from Multifamily Design+Construction.
Market Data | Sep 1, 2021
Construction spending posts small increase in July
Coronavirus, soaring costs, and supply disruptions threaten to erase further gains.
Market Data | Sep 1, 2021
Bradley Corp. survey finds office workers taking coronavirus precautions
Due to the rise in new strains of the virus, 70% of office workers have implemented a more rigorous handwashing regimen versus 59% of the general population.
Market Data | Aug 31, 2021
Three out of four metro areas add construction jobs from July 2020 to July 2021
COVID, rising costs, and supply chain woes may stall gains.
Market Data | Aug 24, 2021
July construction employment lags pre-pandemic peak in 36 states
Delta variant of coronavirus threatens to hold down further gains.
Market Data | Aug 17, 2021
Demand for design activity continues to expand
The ABI score for July was 54.6.


