Transwestern’s first quarter national office report confirmed the general opinion that the U.S. office market remains strong, with overall vacancy holding steady at 9.8%. National average asking rents nudged higher during the quarter to $26.63 per square foot, reflecting a 4.1% annual growth rate that exceeded the five-year compound annual average (CAGR) of 3.4%.
Of the 49 U.S. markets tracked by Transwestern, 45 reported positive rent growth, with 24 of those recording rates above 3.0%. The leaders in rent growth included Minneapolis; San Francisco; San Jose, California; Nashville, Tennessee; Raleigh/Durham, North Carolina; Tampa, Florida; Pittsburgh; California’s Inland Empire; Manhattan; and Charlotte, North Carolina.
“The U.S. economy grew 3.2% in the first quarter, the highest first-quarter growth in four years,” said Ryan Tharp, Research Director in Dallas. “That said, we are closely watching how factors such as U.S. trade conditions might impact the domestic economy in the remainder of 2019.”
Overall office leasing activity in the U.S. has slowed since 2016 but still ended the first quarter 1.5 million square feet higher than a year ago. Net absorption fell to 10.9 million square feet, with sublet space recording negative growth of 1.6 million square feet.
Construction activity jumped 9.7% during the past year, the highest level in the current cycle, but rising land and construction costs and labor challenges continue to limit new building deliveries and stave off systemic overbuilding that undermined some previous cycles.
“Solid fundamentals and adequate debt and equity capital bode well for continued, healthy performance in the office sector and cap rates remain at historic lows,” Tharp said. “We expect asking rents to settle at an annual rate of growth between 3.0% and 3.5% by the end of the year.”
Download the full National Office Market Report at: http://twurls.com/1q19-us-office
Related Stories
Market Data | Apr 20, 2021
Demand for design services continues to rapidly escalate
AIA’s ABI score for March rose to 55.6 compared to 53.3 in February.
Market Data | Apr 16, 2021
Construction employment in March trails March 2020 mark in 35 states
Nonresidential projects lag despite hot homebuilding market.
Market Data | Apr 13, 2021
ABC’s Construction Backlog slips in March; Contractor optimism continues to improve
The Construction Backlog Indicator fell to 7.8 months in March.
Market Data | Apr 9, 2021
Record jump in materials prices and supply chain distributions threaten construction firms' ability to complete vital nonresidential projects
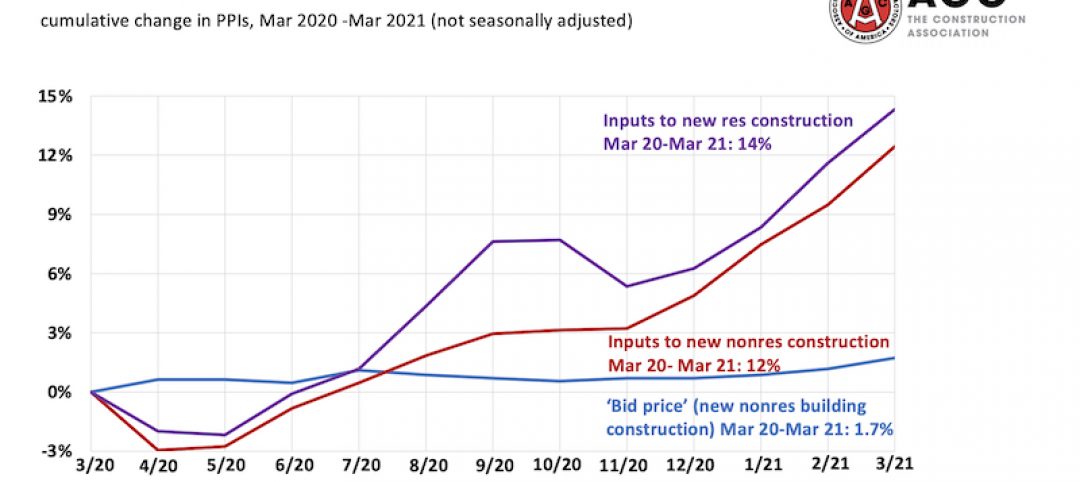
A government index that measures the selling price for goods used construction jumped 3.5% from February to March.
Contractors | Apr 9, 2021
Construction bidding activity ticks up in February
The Blue Book Network's Velocity Index measures month-to-month changes in bidding activity among construction firms across five building sectors and in all 50 states.
Industry Research | Apr 9, 2021
BD+C exclusive research: What building owners want from AEC firms
BD+C’s first-ever owners’ survey finds them focused on improving buildings’ performance for higher investment returns.
Market Data | Apr 7, 2021
Construction employment drops in 236 metro areas between February 2020 and February 2021
Houston-The Woodlands-Sugar Land and Odessa, Texas have worst 12-month employment losses.
Market Data | Apr 2, 2021
Nonresidential construction spending down 1.3% in February, says ABC
On a monthly basis, spending was down in 13 of 16 nonresidential subcategories.
Market Data | Apr 1, 2021
Construction spending slips in February
Shrinking demand, soaring costs, and supply delays threaten project completion dates and finances.
Market Data | Mar 26, 2021
Construction employment in February trails pre-pandemic level in 44 states
Soaring costs, supply-chain problems jeopardize future jobs.


