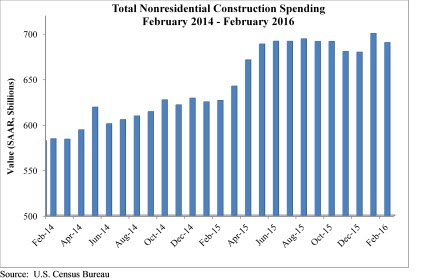
Nonresidential construction spending dipped in February, falling 1.4% on a monthly basis according to analysis of U.S. Census Bureau data released by Associated Builders and Contractors (ABC).
Spending in the nonresidential sector totaled $690.3 billion on a seasonally adjusted, annualized basis in February. While this represents a step back from January's figure of $700.3 billion (revised down from $701.9 billion), it is still 1.5% higher than the level of spending registered in December 2015 and 10.1% higher than February 2015.
"February's weather was particularly harsh in certain parts of the country, including in the economic activity-rich Mid-Atlantic region, and that appears to have had an undue effect on construction spending data," ABC Chief Economist Anirban Basu said. "February data are always difficult to interpret, and the latest nonresidential construction spending figures are no different. Seasonal factors have also made state-level data very difficult to interpret.
"Beyond meteorological considerations, there are other reasons not to be alarmed by February's decline in nonresidential construction spending," Basu said. "Today's positive construction employment report indicates continued economic growth. Moreover, much of the decline in volume was attributable to manufacturing, but the ISM manufacturing index recently crossed the threshold 50 level, indicating that domestic manufacturing is now expanding for the first time in seven months."
Eight of the 16 nonresidential subsectors experienced spending decreases in February, though almost half of the total decline in spending is attributable to the 5.9% decline in manufacturing-related spending.
The following 16 nonresidential construction sectors experienced spending increases in February on a monthly basis:
- Spending in the amusement and recreation category climbed 0.4% from January and is up 13.7% from February 2015.
- Lodging-related spending is up 0.4% for the month and is up 30.1% on a year-ago basis.
- Water supply-related spending expanded 1.9% on a monthly basis and 3.2% on a yearly basis.
- Spending in the office category grew 3.8% from January and is up 25.3% on a year-ago basis.
- Transportation-related spending expanded 0.5% month-over-month and 5.8% year-over-year.
- Health care-related spending expanded 2% from January and is up 3.3% from February 2015.
- Public safety-related spending is up 1.8% for the month, but is down 5.3% for the year.
- Commercial-related construction spending inched 0.1% higher for the month and grew 11% for the year.
Spending in eight of the nonresidential construction subsectors fell in February on a monthly basis:
- Educational-related construction spending fell 2.4% from January, but has expanded 8.5% on a yearly basis.
- Communication-related spending fell 15% month-over-month, but expanded 11.8% year-over-year.
- Spending in the highway and street category fell 2% from January, but is 24.5 higher than one year ago.
- Sewage and waste disposal-related spending fell 2.4% for the month, but is up 2.3% for the year.
- Conservation and development-related spending is 4.6% lower on a monthly basis and 16.8% lower on a year-over-year basis.
- Spending in the religious category fell 4% for the month and is up just 0.7% for the year.
- Manufacturing-related spending fell 5.9% on a monthly basis and is up only 0.8% on a yearly basis.
- Spending in the power category fell 0.6% from January, but is 4.8% higher than one year ago.
Related Stories
Market Data | Nov 22, 2021
Only 16 states and D.C. added construction jobs since the pandemic began
Texas, Wyoming have worst job losses since February 2020, while Utah, South Dakota add the most.
Market Data | Nov 10, 2021
Construction input prices see largest monthly increase since June
Construction input prices are 21.1% higher than in October 2020.
Market Data | Nov 9, 2021
Continued increases in construction materials prices starting to drive up price of construction projects
Supply chain and labor woes continue.
Market Data | Nov 5, 2021
Construction firms add 44,000 jobs in October
Gain occurs even as firms struggle with supply chain challenges.
Market Data | Nov 3, 2021
One-fifth of metro areas lost construction jobs between September 2020 and 2021
Beaumont-Port Arthur, Texas and Sacramento--Roseville--Arden-Arcade Calif. top lists of gainers.
Market Data | Nov 2, 2021
Construction spending slumps in September
A drop in residential work projects adds to ongoing downturn in private and public nonresidential.
Hotel Facilities | Oct 28, 2021
Marriott leads with the largest U.S. hotel construction pipeline at Q3 2021 close
In the third quarter alone, Marriott opened 60 new hotels/7,882 rooms accounting for 30% of all new hotel rooms that opened in the U.S.
Hotel Facilities | Oct 28, 2021
At the end of Q3 2021, Dallas tops the U.S. hotel construction pipeline
The top 25 U.S. markets account for 33% of all pipeline projects and 37% of all rooms in the U.S. hotel construction pipeline.
Market Data | Oct 27, 2021
Only 14 states and D.C. added construction jobs since the pandemic began
Supply problems, lack of infrastructure bill undermine recovery.
Market Data | Oct 26, 2021
U.S. construction pipeline experiences highs and lows in the third quarter
Renovation and conversion pipeline activity remains steady at the end of Q3 ‘21, with conversion projects hitting a cyclical peak, and ending the quarter at 752 projects/79,024 rooms.


