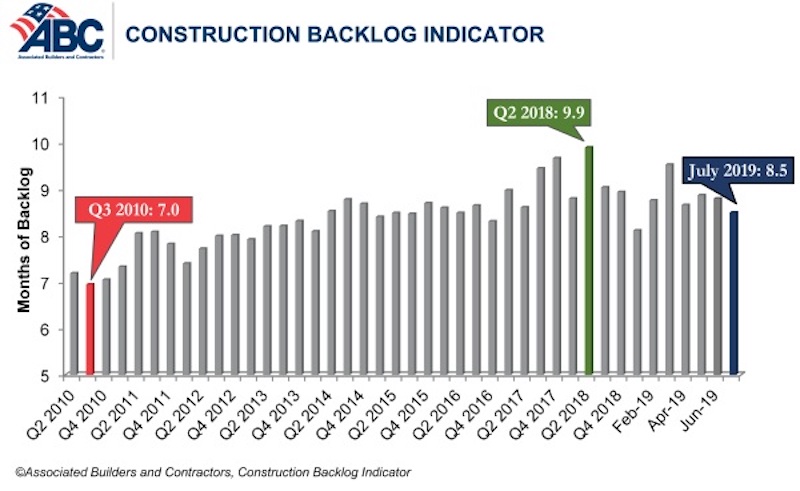
Associated Builders and Contractors reported today that its Construction Backlog Indicator fell to 8.5 months in July 2019, down 0.3 months or 2.9% from June 2019, when CBI stood at 8.8 months.
“Construction backlog declined in all four major regions in July,” said ABC Chief Economist Anirban Basu. “While the Northeast and South—the regions with the lengthiest backlog—experienced minor dips, the West and the Middle States exhibited more significant declines. Despite the 9.3% monthly decline in the West region, backlog remains above levels observed in early 2019. For the Middle States, however, backlog is at its lowest level since the last quarter of 2015, largely due to a dip in activity in the commercial/institutional segment, the largest segment represented in ABC’s survey.
“Among the three industry subsegments measured by CBI, only the commercial/institutional category experienced a backlog decrease in July 2019,” said Basu. “Backlog in the heavy industrial category increased by 2.3 months and now stands at its highest level in the history of the CBI series. This is largely attributable to the energy sector, with particular strength apparent in the South. Regions tied to traditional manufacturing activities did not fare as well in July.
“Only companies with revenues lower than $30 million per year experienced shorter backlog in July,” said Basu. “This may be cause for concern since smaller firms tend to be more vulnerable to economic fluctuations. Much of the decline in backlog among this group occurred among those specializing in commercial construction.
“Despite the recent, albeit brief, losing streak, backlog levels remain consistent with healthy construction activity over the near-term,” said Basu. “Contractors collectively expect rising sales to continue and are planning to add to staffing levels, though their exuberance has been somewhat tempered in recent months. If the U.S. economy continues to soften, including in the nation’s manufacturing industry, contractor confidence levels will likely continue to subside along with backlog. Yet, for now, the nation’s nonresidential construction segment remains busy.”


Related Stories
Market Data | Aug 13, 2018
First Half 2018 commercial and multifamily construction starts show mixed performance across top metropolitan areas
Gains reported in five of the top ten markets.
Market Data | Aug 10, 2018
Construction material prices inch down in July
Nonresidential construction input prices increased fell 0.3% in July but are up 9.6% year over year.
Market Data | Aug 9, 2018
Projections reveal nonresidential construction spending to grow
AIA releases latest Consensus Construction Forecast.
Market Data | Aug 7, 2018
New supply's impact illustrated in Yardi Matrix national self storage report for July
The metro with the most units under construction and planned as a percent of existing inventory in mid-July was Nashville, Tenn.
Market Data | Aug 3, 2018
U.S. multifamily rents reach new heights in July
Favorable economic conditions produce a sunny summer for the apartment sector.
Market Data | Aug 2, 2018
Nonresidential construction spending dips in June
“The hope is that June’s construction spending setback is merely a statistical aberration,” said ABC Chief Economist Anirban Basu.
Market Data | Aug 1, 2018
U.S. hotel construction pipeline continues moderate growth year-over-year
The hotel construction pipeline has been growing moderately and incrementally each quarter.
Market Data | Jul 30, 2018
Nonresidential fixed investment surges in second quarter
Nonresidential fixed investment represented an especially important element of second quarter strength in the advance estimate.
Market Data | Jul 11, 2018
Construction material prices increase steadily in June
June represents the latest month associated with rapidly rising construction input prices.
Market Data | Jun 26, 2018
Yardi Matrix examines potential regional multifamily supply overload
Outsize development activity in some major metros could increase vacancy rates and stagnate rent growth.


