Associated Builders and Contractors reports today that its Construction Backlog Indicator increased to nine months in May from 8.8 months in April, according to an ABC member survey conducted May 17 to June 3. The reading is up one month from May 2021.
View ABC’s Construction Backlog Indicator and Construction Confidence Index tables for May 2022.
Backlog in the infrastructure segment jumped from 8.7 months in April to 9.3 months in May, and the Northeast and South regions continue to outperform the Middle States and the West. Contractors with more than $100 million in annual revenues enjoyed the highest backlog, at 13.2 months.
ABC’s Construction Confidence Index readings for sales, profit margins and staffing levels declined in May. The indices for sales and staffing remain above the threshold of 50, indicating expectations of growth over the next six months, while the reading for profit margins was exactly 50 for the month.
“It is simply remarkable that contractors continue to add to backlog amidst global strife, rising materials prices and ubiquitous labor force challenges,” said ABC Chief Economist Anirban Basu. “Backlog is up in every segment over the past year, including in the somewhat shaky commercial category. The largest increase in backlog has been registered in the industrial segment. More American companies are committing to place additional supply chain capacity in the United States, with Intel and Ford representing particularly recent and noteworthy examples.
“For contractors, the challenge will continue to be the cost of delivering construction services,” said Basu. “The risk of severe increases in costs and substantial delays in delivery remains elevated given the volatility in input prices, the propensity of the labor force to shift jobs in large numbers and equipment shortages and delays. This ABC survey indicates that the proportion of contractors who expect that profit margins will expand over the next six months is declining, a reflection of lingering, worsening supply chain challenges.”
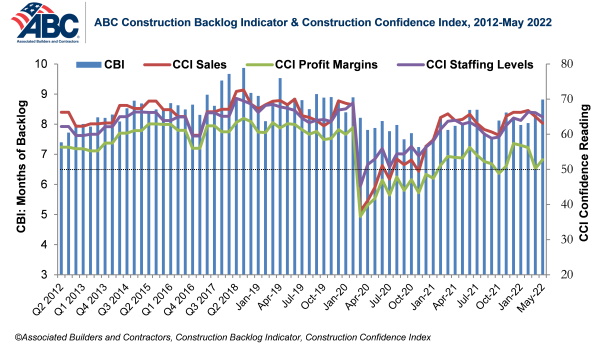
Note: The reference months for the Construction Backlog Indicator and Construction Confidence Index data series were revised on May 12, 2020, to better reflect the survey period. CBI quantifies the previous month’s work under contract based on the latest financials available, while CCI measures contractors’ outlook for the next six months.
Related Stories
Market Data | Jun 16, 2021
Producer prices for construction materials and services jump 24% over 12 months
The 24.3% increase in prices for materials used in construction from May 2020 to last month was nearly twice as great as in any previous year
Market Data | Jun 15, 2021
ABC’s Construction Backlog inches higher in May
Materials and labor shortages suppress contractor confidence.
Market Data | Jun 11, 2021
The countries with the most green buildings
As the country that set up the LEED initiative, the US is a natural leader in constructing green buildings.
Market Data | Jun 7, 2021
Construction employment slips by 20,000 in May
Seasonally adjusted construction employment in May totaled 7,423,000.
Market Data | Jun 2, 2021
Construction employment in April lags pre-covid February 2020 level in 107 metro areas
Houston-The Woodlands-Sugar Land and Odessa, Texas have worst 14-month construction job losses.
Market Data | Jun 1, 2021
Nonresidential construction spending decreases 0.5% in April
Spending was down on a monthly basis in nine of 16 nonresidential subcategories.
Market Data | Jun 1, 2021
Nonresidential construction outlays drop in April to two-year low
Public and private work declines amid supply-chain woes, soaring costs.
Market Data | May 24, 2021
Construction employment in April remains below pre-pandemic peak in 36 states and D.C.
Texas and Louisiana have worst job losses since February 2020, while Utah and Idaho are the top gainers.
Market Data | May 19, 2021
Design activity strongly increases
Demand signals construction is recovering.
Multifamily Housing | May 18, 2021
Multifamily housing sector sees near record proposal activity in early 2021
The multifamily sector led all housing submarkets, and was third among all 58 submarkets tracked by PSMJ in the first quarter of 2021.


