Nearly one-third of architecture, engineering and construction (A/E/C) firms have furloughed or laid off employees due to COVID-19, and more than 90% say they have experienced at least some project delays or cancellations, according to a new survey of firm leaders conducted by PSMJ Resources. In general, however, the industry has weathered the crisis better than most. The survey also found that less than 5% of responding firms suffered “significant” staff reductions, and under 15% said that their project delays and cancellations were “major” as opposed to moderate or minor.
The data is from a new monthly supplement to PSMJ’s Quarterly Market Forecast (QMF) survey of A/E/C firms. The QMF, produced quarterly by PSMJ since 2003, measures proposal activity overall and for a variety of markets and submarkets served by A/E/C firms. The August results for proposal opportunities suggest that the bleeding has stopped and the industry’s recovery is well underway. After reaching lows in the 2nd Quarter unseen since the Great Recession, proposal activity rebounded in July and August, overall and across most market sectors.
"The A/E/C Industry has fared much better than most industries during the Covid-19 pandemic. In fact, many firms are reporting their best year ever,” says PSMJ Senior Principal David Burstein, P.E., AECPM. “The Paycheck Protection loan program designed to limit staff reductions has certainly helped keep layoffs down to about 5% of the industry workforce, and hiring has been accelerating for the past three months. At the same time, proposal activity has returned to a level where the number of firms reporting growth in opportunities is equal to or slightly higher than those saying proposal activity is down."
Quarterly Market Forecast Supplement– COVID’s Impact on Layoffs through March vs. August
Earlier data on the effects of COVID, collected by PSMJ as part of its 1st Quarter QMF survey, found that fewer than one of every five firms had conducted layoffs by the end of March, while a percentage of firms that had experienced no project delays or cancellations fell from 12.4% in March to 8.4% in August
Quarterly Market Forecast Supplement– COVID’s Impact on Projects through March vs. August
After bottoming out at -41% in April and -22% for the 2nd Quarter, the QMF’s Net Plus/Minus Index (NPMI) for overall proposal activity improved to +2% in July and stayed relatively level at +1% in August. PSMJ’s NPMI represents the difference between the percentage of firms reporting an increase in proposal activity and those reporting a decrease for the subject period. For August, 33.1% of respondents said they saw increased proposal activity compared with 31.8% who reported a decrease. The remainder said proposal activity was about the same from July to August.
Among the 12 markets measured, healthcare returned to the top spot with an NPMI of +31% after slipping in the 2nd Quarter. It was followed by Energy/Utilities (29%) and a surging Housing market (27%). Water/Wastewater (20%) continues to be solid amid the COVID crisis, while Heavy Industry and Environmental (both 9%) rounded out the Top 6. Education (-29%) remains a troubled market, tied for second-worst with Commercial Developers and trailing only Commercial Users (-36%).
PSMJ has been using the QMF as a measure of the design and construction industry’s health every quarter for the past 17 years, assessing the results overall and across 12 major markets and 58 submarkets. The company chose proposal activity because it represents one of the earliest stages of the project lifecycle. A consistent group of over 300 firm leaders participate, including 155 responding for the August supplement.
Related Stories
Market Data | Nov 27, 2023
Number of employees returning to the office varies significantly by city
While the return-to-the-office trend is felt across the country, the percentage of employees moving back to their offices varies significantly according to geography, according to Eptura’s Q3 Workplace Index.
Market Data | Nov 14, 2023
The average U.S. contractor has 8.4 months worth of construction work in the pipeline, as of September 2023
Associated Builders and Contractors reported that its Construction Backlog Indicator declined to 8.4 months in October from 9.0 months in September, according to an ABC member survey conducted from Oct. 19 to Nov. 2. The reading is down 0.4 months from October 2022. Backlog now stands at its lowest level since the first quarter of 2022.
Multifamily Housing | Nov 9, 2023
Multifamily project completions forecast to slow starting 2026
Yardi Matrix has released its Q4 2023 Multifamily Supply Forecast, emphasizing a short-term spike and plateau of new construction.
Contractors | Nov 1, 2023
Nonresidential construction spending increases for the 16th straight month, in September 2023
National nonresidential construction spending increased 0.3% in September, according to an Associated Builders and Contractors analysis of data published today by the U.S. Census Bureau. On a seasonally adjusted annualized basis, nonresidential spending totaled $1.1 trillion.
Market Data | Oct 23, 2023
New data finds that the majority of renters are cost-burdened
The most recent data derived from the 2022 Census American Community Survey reveals that the proportion of American renters facing housing cost burdens has reached its highest point since 2012, undoing the progress made in the ten years leading up to the pandemic.
Contractors | Oct 19, 2023
Crane Index indicates slowing private-sector construction
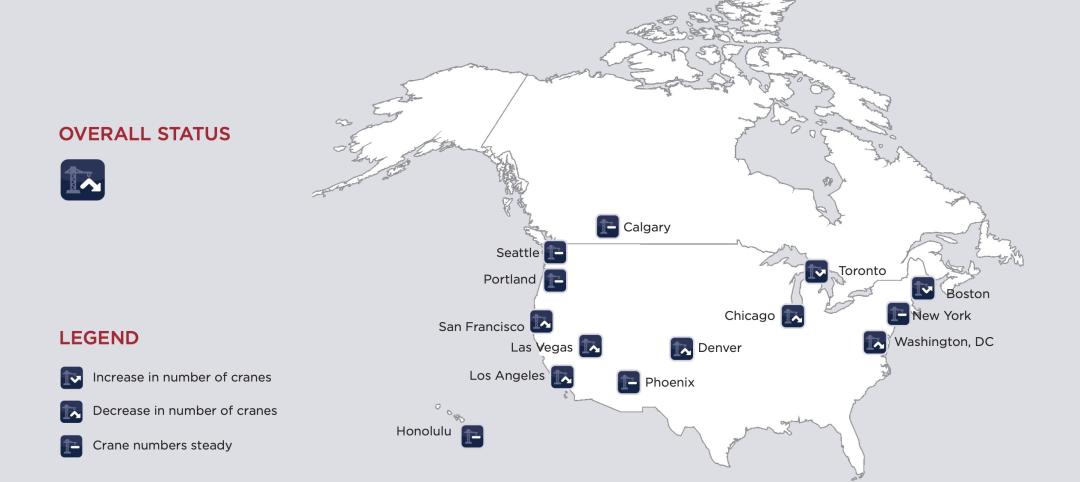
Private-sector construction in major North American cities is slowing, according to the latest RLB Crane Index. The number of tower cranes in use declined 10% since the first quarter of 2023. The index, compiled by consulting firm Rider Levett Bucknall (RLB), found that only two of 14 cities—Boston and Toronto—saw increased crane counts.
Market Data | Oct 2, 2023
Nonresidential construction spending rises 0.4% in August 2023, led by manufacturing and public works sectors
National nonresidential construction spending increased 0.4% in August, according to an Associated Builders and Contractors analysis of data published today by the U.S. Census Bureau. On a seasonally adjusted annualized basis, nonresidential spending totaled $1.09 trillion.
Giants 400 | Sep 28, 2023
Top 100 University Building Construction Firms for 2023
Turner Construction, Whiting-Turner Contracting Co., STO Building Group, Suffolk Construction, and Skanska USA top BD+C's ranking of the nation's largest university sector contractors and construction management firms for 2023, as reported in Building Design+Construction's 2023 Giants 400 Report. Note: This ranking includes revenue for all university/college-related buildings except student residence halls, sports/recreation facilities, laboratories, S+T-related buildings, parking facilities, and performing arts centers (revenue for those buildings are reported in their respective Giants 400 ranking).
Construction Costs | Sep 28, 2023
U.S. construction market moves toward building material price stabilization
The newly released Quarterly Construction Cost Insights Report for Q3 2023 from Gordian reveals material costs remain high compared to prior years, but there is a move towards price stabilization for building and construction materials after years of significant fluctuations. In this report, top industry experts from Gordian, as well as from Gilbane, McCarthy Building Companies, and DPR Construction weigh in on the overall trends seen for construction material costs, and offer innovative solutions to navigate this terrain.
Data Centers | Sep 21, 2023
North American data center construction rises 25% to record high in first half of 2023, driven by growth of artificial intelligence
CBRE’s latest North American Data Center Trends Report found there is 2,287.6 megawatts (MW) of data center supply currently under construction in primary markets, reaching a new all-time high with more than 70% already preleased.


