Led by a still active multi-family housing market and sustained by solid levels of demand for new commercial and retail properties, the Architecture Billings Index has accelerated to its highest score in nearly a year.
As a leading economic indicator of construction activity, the ABI reflects the approximate nine to 12 month lead time between architecture billings and construction spending. The American Institute of Architects (AIA) reported the May ABI score was 53.1, up sharply from the mark of 50.6 in the previous month. This score reflects an increase in design services (any score above 50 indicates an increase in billings). The new projects inquiry index was 60.1, up from a reading of 56.9 the previous month.
“Business conditions at design firms have hovered around the break-even rate for the better part of this year,” said AIA Chief Economist, Kermit Baker, Hon. AIA, PhD. “Demand levels are solid across the board for all project types at the moment. Of particular note, the recent surge in design activity for institutional projects could be a harbinger of a new round of growth in the broader construction industry in the months ahead.”
Key May ABI highlights:
- Regional averages: West (53.8), South (53.7), Northeast (51.2), Midwest (49.9)
- Sector index breakdown: multi-family residential (53.7), institutional (53.0), commercial/industrial (51.0), mixed practice (51.0),
- Project inquiries index: 60.1
- Design contracts index: 52.8
- The regional and sector categories are calculated as a 3-month moving average, whereas the national index, design contracts and inquiries are monthly numbers.
Related Stories
Architects | Sep 11, 2019
Buoyed by construction activity, architect compensation continues to see healthy gains
The latest AIA report breaks down its survey data by 44 positions and 28 metros.
Multifamily Housing | Sep 10, 2019
Carbon-neutral apartment building sets the pace for scalable affordable housing
Project Open has no carbon footprint, but the six-story, solar-powered building is already leaving its imprint on Salt Lake City’s multifamily landscape.
Giants 400 | Sep 9, 2019
Top 70 Industrial Sector Architecture Firms for 2019
AECOM, Stantec, Ware Malcomb, FSB, and Macgregor Associates top the rankings of the nation's largest industrial sector architecture and architecture engineering (AE) firms, as reported in Building Design+Construction's 2019 Giants 300 Report.
Giants 400 | Sep 9, 2019
2019 Industrial Sector Giants Report: Managing last mile delivery
This and more industrial building sector trends from Building Design+Construction's 2019 Giants 300 Report.
Codes and Standards | Sep 9, 2019
Free app calculates maximum allowable heights and areas for buildings
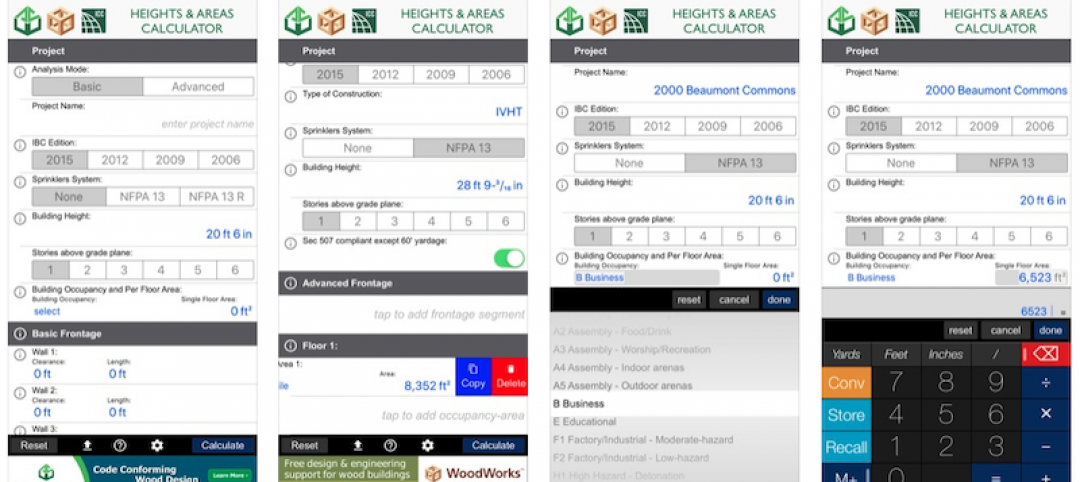
A free app that calculates the maximum allowable heights and areas for buildings of various occupancy classifications and types of construction has been released.
Retail Centers | Sep 6, 2019
Another well-known retailer files for bankruptcy: Here's the solution to more empty anchor stores
Where can you find the future of retail? At the intersection of experience and instant gratification.
Giants 400 | Sep 5, 2019
Top 110 Hotel Sector Architecture Firms for 2019
Gensler, WATG, HKS, HBG Design, and Steelman Partners top the rankings of the nation's largest hotel sector architecture and architecture engineering (AE) firms, as reported in Building Design+Construction's 2019 Giants 300 Report.
Architects | Sep 5, 2019
AIA launches landmark initiative to drive climate action
AIA Board of Directors approves member-led resolution to rally architects in mitigating and adapting the built environment.
Giants 400 | Sep 3, 2019
Top 140 K-12 School Sector Architecture Firms for 2019
DLR Group, PBK, Huckabee, Stantec, and VLK Architects top the rankings of the nation's largest K-12 school sector architecture and architecture engineering (AE) firms, as reported in Building Design+Construction's 2019 Giants 300 Report.
Market Data | Sep 3, 2019
Nonresidential construction spending slips in July 2019, but still surpasses $776 billion
Construction spending declined 0.3% in July, totaling $776 billion on a seasonally adjusted annualized basis.


