This is the 30th year that the Joint Center for Housing Studies of Harvard University has put out an annual State of the Nation’s Housing report. And what a period that’s been, with more than 40 million new units built and 27 million new households created.
“By many metrics, the housing market is on sound footing,” the report states. (The document can be downloaded from here.)
But as it has for almost every year of this publication’s existence, the Joint Center also identifies a housing market that is economically prohibitive for too many Americans, a growing number of whom are renting rather than owning by choice or necessity.
Its latest report, which the Joint Center releases today, portrays a market where more younger adults are renting than any time since 1988; and where the cost of housing continue to rise—because of higher building materials and labor expenses, land prices, and regulations—beyond many potential purchasers’ reach.
Market conditions and demographics are such that the Joint Center has lowered its projections for household growth through 2027 to 12 million, versus the 13.6 million projection it made just last year. And despite the prediction that immigrants will increasingly drive household growth, the Joint Center’s new outlook “reflects lower net foreign immigration and higher mortality rates among native-born whites,” the report states.
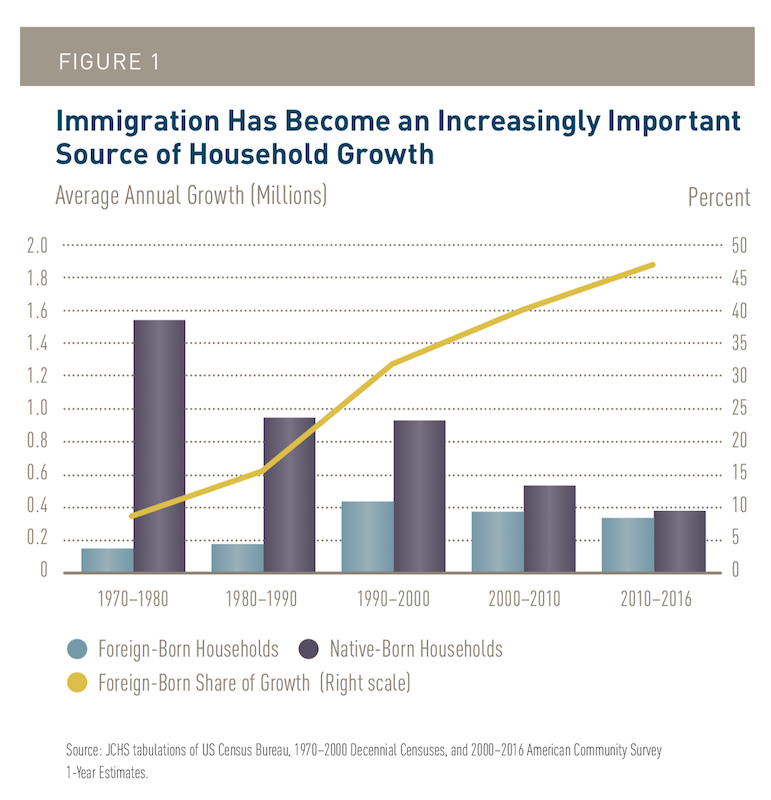
While immigration continues to drive household formations in the U.S., the Joint Center sees that impact tailing off over the next several years, partly because of govenrment policy decisions. Image: JCHS
The Joint Center has its fingers crossed that Millennials, who are part of a cohort under the age of 35 that formed 10.5 million new households in 2012-2017, will lift household growth.
Millennials are still predisposed to rent, rather than own, to be nearer urban job centers and for purposes of mobility. But speaking of renters: the blush might finally be wearing off that rose. Growth in the number of renter households slowed from 850,000 annually on average in 2005–2015 to just 220,000 in 2015–2017, while the number of owner households rose 710,000 annually on average in the past two years.
This reversal lifted the national homeownership rate to 63.9 percent last year. “While too early to tell whether this is the start of a rebound, the homeownership rate appears to have at least stabilized,” the report says.
The caveats are that homeownership among the youngest adults is currently 4.2 percentage points lower than in 1994 and 6.3 percentage points under what it was in 1987. And homeownership among African-Americans is nearing 30-year lows, with the gap between blacks and white homeowners widening to 29.2 percentage points.
The Joint Center takes a glass-half-full view of this disparity. “The wide gap in white-minority homeownership rates conflicts with evidence from consumer surveys that renters of all races and ethnicities want to own homes in the future. Given both the desire to own and the ability of many renters to sustain homeownership, restricted homebuying opportunities for minorities should be a critical public concern.”
Supply and demand out of kilter
Homeownership is a function of supply and demand, and right now existing and new housing are in tight supply, which inevitably impacts affordability.
In 2017, the supply of for-sale homes averaged only 3.9 months; Zillow estimated that inventories were under two months in one third of the 93 metros it tracked. And affordable housing is in even scarcer supply. “Virtually all of the 88 metros with data available had more homes for sale in the top third of the market by price than in the bottom third. In 46 of these metros, more than half of the available supply was at the high end,” the Joint Center reports.
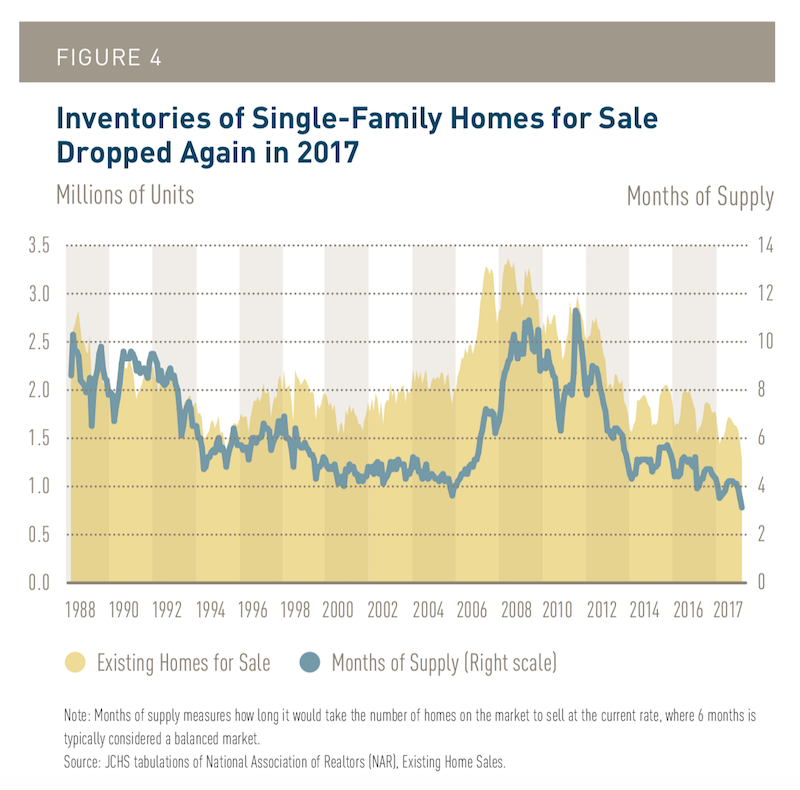
A healthy housing market would have at least six months of supply available for sale; many markets last year had only two months available. And what's for sale is more often priced at the higher end. Image: JCHS
Homebuilding, while increasing in each of the past six years, simply isn’t keeping pace with perceived demand. Last year, for example, 849,000 single-family homes were started, well below the long-run average of 1.1 million units.
There are a number of reasons why more housing isn’t being built, starting with land availability. The Joint Center cites Metrostudy data that found a 36% decrease, from 2008 to 2017, in the inventory of vacant buildable lots in 98 metros. In 21 of the country’s 25 largest metros, land inventory supported less than 24 months of residential construction.
Multifamily construction isn’t easing the cost burden sufficiently, either. While the number of occupied rental units rose by 21% from 2006 to 2016, lowest-cost rentals shrank by more than 10% in 153 of the nation’s 381 metros, and by more than 20% in 89 metros.
Lowest income families struggle for decent living
Consequently, about one third of all households in most metros are cost burdened. The Joint Center reports that in 2016, 38.1 million households spent more than 30% of their increases on housing. Nearly half of all renters—47%—are cost burdened, too.
The Joint Center is on record advocating for policy changes that would increase housing subsidies for low-income families, while conceding that increases in federal rental assistance lag behind the growth of renters with very low incomes, a number that grew by 6 million between 1987 and 2015, a period during which the number receiving assistance increased by only 950,000.
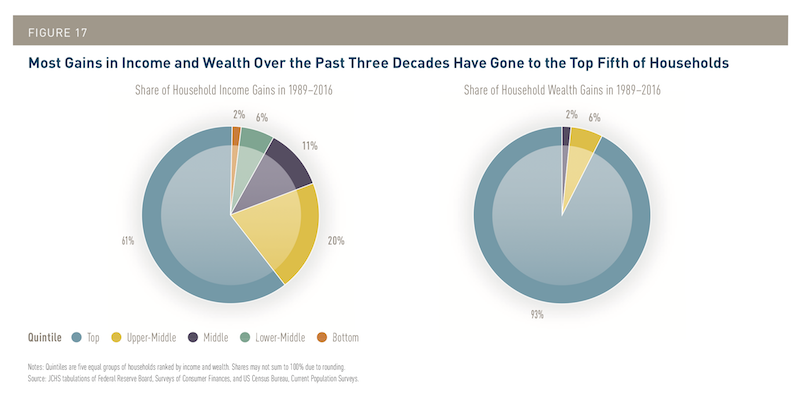
The rich get richer, and most of the wealth gains over the past three decades accrued to more affluent households. Image: JCHS
Meanwhile, federal downpayment assistance programs serve fewer than 50,000 households annually.
The Joint Center’s outlook on housing is decidedly mixed. It sees opportunities for single- and multifamily construction, but continues to fret over housing costs rising faster than household incomes, which effectively prices out a percentage of the population from the housing market.
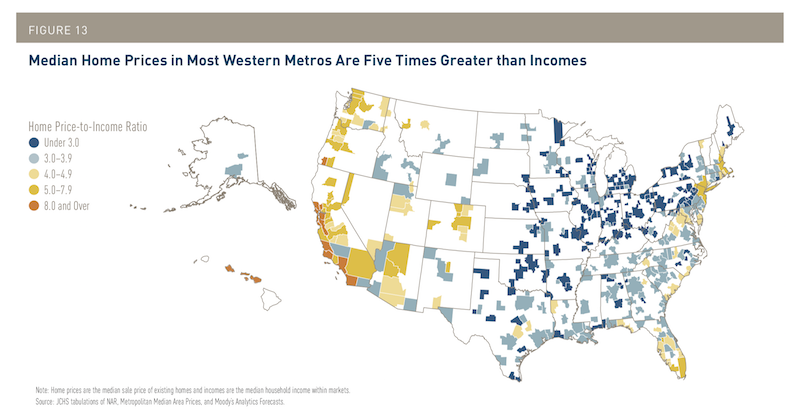
The home price-to-income ratio in many parts of the country is making ownership prohibitive. Image: JCHS
“National efforts are necessary to close the affordability gap,” the Joint Center states. “Housing policymakers have many opportunities to address the cost side of the equation, including the increasing size and quality of homes; lack of productivity improvements in the residential construction sector; escalating costs of labor, building materials, and land; and barriers created by a complex and restrictive regulatory system. However, tackling this broad mix of conditions will require collaboration of the public, private, and nonprofit sectors in a comprehensive strategy that fosters innovation in the design, construction, financing, and regulation of housing.”
Even if all this were to happen, the Joint Center still sees millions of households who are unable to afford decent housing without public subsidies.
“Many state and local governments are doing their part to expand assistance, but a more robust federal response is essential to any meaningful progress in combatting the nation’s housing affordability crisis.”
Related Stories
Market Data | Oct 19, 2021
Demand for design services continues to increase
The Architecture Billings Index (ABI) score for September was 56.6.
Market Data | Oct 14, 2021
Climate-related risk could be a major headwind for real estate investment
A new trends report from PwC and ULI picks Nashville as the top metro for CRE prospects.
Market Data | Oct 14, 2021
Prices for construction materials continue to outstrip bid prices over 12 months
Construction officials renew push for immediate removal of tariffs on key construction materials.
Market Data | Oct 11, 2021
No decline in construction costs in sight
Construction cost gains are occurring at a time when nonresidential construction spending was down by 9.5 percent for the 12 months through July 2021.
Market Data | Oct 11, 2021
Nonresidential construction sector posts first job gain since March
Has yet to hit pre-pandemic levels amid supply chain disruptions and delays.
Market Data | Oct 4, 2021
Construction spending stalls between July and August
A decrease in nonresidential projects negates ongoing growth in residential work.
Market Data | Oct 1, 2021
Nonresidential construction spending dips in August
Spending declined on a monthly basis in 10 of the 16 nonresidential subcategories.
Market Data | Sep 29, 2021
One-third of metro areas lost construction jobs between August 2020 and 2021
Lawrence-Methuen Town-Salem, Mass. and San Diego-Carlsbad, Calif. top lists of metros with year-over-year employment increases.
Market Data | Sep 28, 2021
Design-Build projects should continue to take bigger shares of construction spending pie over next five years
FMI’s new study finds collaboration and creativity are major reasons why owners and AEC firms prefer this delivery method.
Market Data | Sep 22, 2021
Architecture billings continue to increase
The ABI score for August was 55.6, up from July’s score of 54.6.


