Headed by the continued strength in the multifamily residential market and the emerging growth for institutional projects, demand for design services continues to be healthy, as exhibited in the latest Architecture Billings Index (ABI).
As a leading economic indicator of construction activity, the ABI reflects the approximate nine to twelve month lead time between architecture billings and construction spending. The American Institute of Architects (AIA) reported the October ABI score was 53.7, down from a mark of 55.2 in September. This score reflects an increase in design activity (any score above 50 indicates an increase in billings). The new projects inquiry index was 62.7, following a mark of 64.8 the previous month.
The AIA has added a new indicator measuring the trends in new design contracts at architecture firms that can provide a strong signal of the direction of future architecture billings. The score for design contracts in October was 56.4.
“Though it has been slow in emerging, we’re finally seeing some momentum develop in design activity for nonprofits and municipal governments, and as such we’re seeing a new round of activity in the institutional sector,” said AIA Chief Economist Kermit Baker, Hon. AIA, PhD. “It will be interesting to see if and how the results of the mid-term Congressional and gubernatorial elections impact this developing momentum.”
Key October ABI highlights:
• Regional averages: South (58.4), West (56.1), Midwest (54.4), Northeast (47.0)
• Sector index breakdown: mixed practice (56.9), multi-family residential (54.7), institutional (54.4), commercial / industrial (52.3)
• Project inquiries index: 62.7
• Design contracts index: 56.4
The regional and sector categories are calculated as a 3-month moving average, whereas the national index, design contracts and inquiries are monthly numbers.
About the AIA Architecture Billings Index
The Architecture Billings Index (ABI), produced by the AIA Economics & Market Research Group, is a leading economic indicator that provides an approximately nine to twelve month glimpse into the future of nonresidential construction spending activity. The diffusion indexes contained in the full report are derived from a monthly “Work-on-the-Boards” survey that is sent to a panel of AIA member-owned firms. Participants are asked whether their billings increased, decreased, or stayed the same in the month that just ended as compared to the prior month, and the results are then compiled into the ABI.
These monthly results are also seasonally adjusted to allow for comparison to prior months. The monthly ABI index scores are centered around 50, with scores above 50 indicating an aggregate increase in billings, and scores below 50 indicating a decline. The regional and sector data are formulated using a three-month moving average. More information on the ABI and the analysis of its relationship to construction activity can be found in the recently released White Paper, Designing the Construction Future: Reviewing the Performance and Extending the Applications of the AIA’s Architecture Billings Index on the AIA website.
Related Stories
Architects | Sep 11, 2019
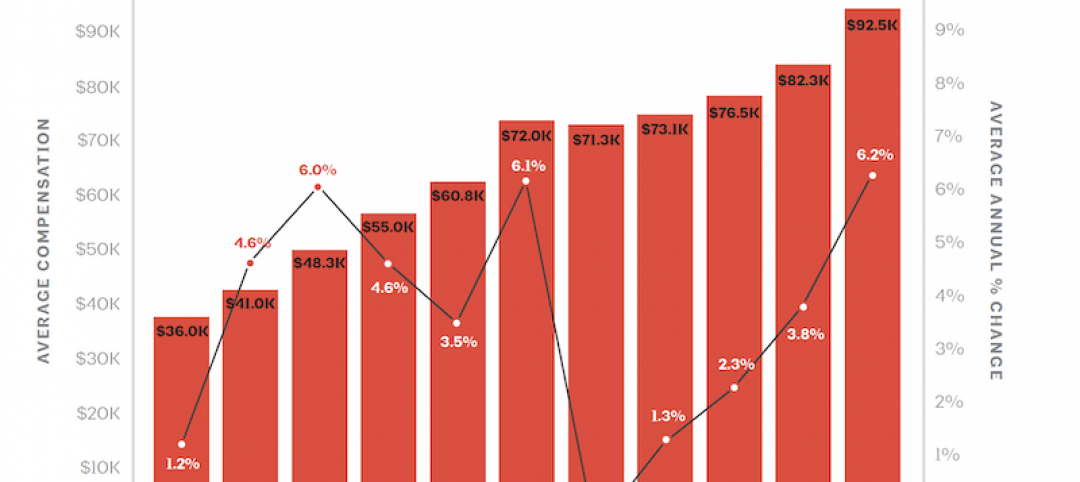
Buoyed by construction activity, architect compensation continues to see healthy gains
The latest AIA report breaks down its survey data by 44 positions and 28 metros.
Multifamily Housing | Sep 10, 2019
Carbon-neutral apartment building sets the pace for scalable affordable housing
Project Open has no carbon footprint, but the six-story, solar-powered building is already leaving its imprint on Salt Lake City’s multifamily landscape.
Giants 400 | Sep 9, 2019
Top 70 Industrial Sector Architecture Firms for 2019
AECOM, Stantec, Ware Malcomb, FSB, and Macgregor Associates top the rankings of the nation's largest industrial sector architecture and architecture engineering (AE) firms, as reported in Building Design+Construction's 2019 Giants 300 Report.
Giants 400 | Sep 9, 2019
2019 Industrial Sector Giants Report: Managing last mile delivery
This and more industrial building sector trends from Building Design+Construction's 2019 Giants 300 Report.
Codes and Standards | Sep 9, 2019
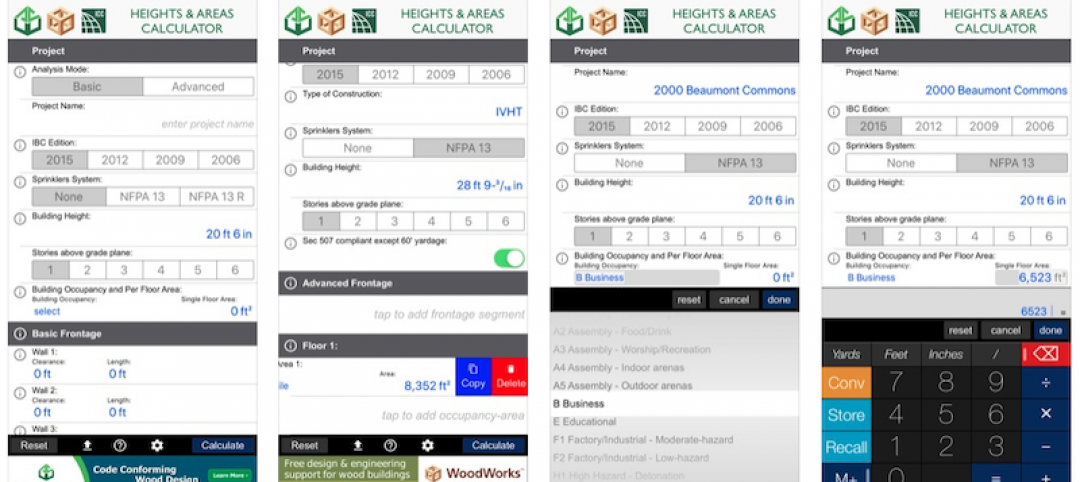
Free app calculates maximum allowable heights and areas for buildings
A free app that calculates the maximum allowable heights and areas for buildings of various occupancy classifications and types of construction has been released.
Retail Centers | Sep 6, 2019
Another well-known retailer files for bankruptcy: Here's the solution to more empty anchor stores
Where can you find the future of retail? At the intersection of experience and instant gratification.
Giants 400 | Sep 5, 2019
Top 110 Hotel Sector Architecture Firms for 2019
Gensler, WATG, HKS, HBG Design, and Steelman Partners top the rankings of the nation's largest hotel sector architecture and architecture engineering (AE) firms, as reported in Building Design+Construction's 2019 Giants 300 Report.
Architects | Sep 5, 2019
AIA launches landmark initiative to drive climate action
AIA Board of Directors approves member-led resolution to rally architects in mitigating and adapting the built environment.
Giants 400 | Sep 3, 2019
Top 140 K-12 School Sector Architecture Firms for 2019
DLR Group, PBK, Huckabee, Stantec, and VLK Architects top the rankings of the nation's largest K-12 school sector architecture and architecture engineering (AE) firms, as reported in Building Design+Construction's 2019 Giants 300 Report.
Market Data | Sep 3, 2019
Nonresidential construction spending slips in July 2019, but still surpasses $776 billion
Construction spending declined 0.3% in July, totaling $776 billion on a seasonally adjusted annualized basis.


