


After its first negative score in 10 months, the Architecture Billings Index (ABI) showed a nominal increase in design activity in February, and has been positive ten out of the past twelve months.
The American Institute of Architects (AIA) reported the February ABI score was 50.4, up slightly from a mark of 49.9 in January. This score reflects a minor increase in design services (any score above 50 indicates an increase in billings).
The new projects inquiry index was 56.6, down from a reading of 58.7 the previous month.
As a leading economic indicator of construction activity, the ABI reflects the approximate nine to twelve month lead time between architecture billings and construction spending.
“The health of the institutional market has been the key factor for positive business conditions for the design and construction industry in recent months, and it is encouraging to see that sector remain on solid footing,” said AIA Chief Economist Kermit Baker, Hon. AIA, PhD. “However, we’re seeing some slowing in the other major construction sectors. Design billings for residential projects had its first negative month in over three years, and commercial design billings have seen only modest growth in recent years.”
Key February ABI highlights:
- Regional averages: South (52.5), Midwest (50.2), Northeast (48.0), West (46.7)
- Sector index breakdown: institutional (52.2), commercial / industrial (51.4), multi-family residential (48.9), mixed practice (45.3)
- Project inquiries index: 56.6
- Design contracts index: 50.0
The regional and sector categories are calculated as a 3-month moving average, whereas the national index, design contracts and inquiries are monthly numbers.
About the AIA Architecture Billings Index
The Architecture Billings Index (ABI), produced by the AIA Economics & Market Research Group, is a leading economic indicator that provides an approximately nine to twelve month glimpse into the future of nonresidential construction spending activity. The diffusion indexes contained in the full report are derived from a monthly “Work-on-the-Boards” survey that is sent to a panel of AIA member-owned firms. Participants are asked whether their billings increased, decreased, or stayed the same in the month that just ended as compared to the prior month, and the results are then compiled into the ABI. These monthly results are also seasonally adjusted to allow for comparison to prior months. The monthly ABI index scores are centered around 50, with scores above 50 indicating an aggregate increase in billings, and scores below 50 indicating a decline. The regional and sector data are formulated using a three-month moving average. More information on the ABI and the analysis of its relationship to construction activity can be found in the recently released White Paper, Designing the Construction Future: Reviewing the Performance and Extending the Applications of the AIA’s Architecture Billings Index on the AIA web site.
Related Stories

Architects | May 26, 2017
Innovations in addressing homelessness
Parks departments and designers find new approaches to ameliorate homelessness.

Architects | May 26, 2017
BIG plans: Architecture isn’t Bjarke Ingels Group’s only growth path
Kai-Uwe Bergmann, the firm’s head of global business development, says engineering and urban planning are key opportunities. And how about that Hyperloop?

Museums | May 25, 2017
The museum as workspace
Many museum staff are resistant to the idea of open offices.
| May 24, 2017
Accelerate Live! talk: Applying machine learning to building design, Daniel Davis, WeWork
Daniel Davis offers a glimpse into the world at WeWork, and how his team is rethinking workplace design with the help of machine learning tools.
| May 24, 2017
Accelerate Live! talk: Learning from Silicon Valley - Using SaaS to automate AEC, Sean Parham, Aditazz
Sean Parham shares how Aditazz is shaking up the traditional design and construction approaches by applying lessons from the tech world.
| May 24, 2017
Accelerate Live! talk: The data-driven future for AEC, Nathan Miller, Proving Ground
In this 15-minute talk at BD+C’s Accelerate Live! (May 11, 2017, Chicago), Nathan Miller presents his vision of a data-driven future for the business of design.
Architects | May 23, 2017
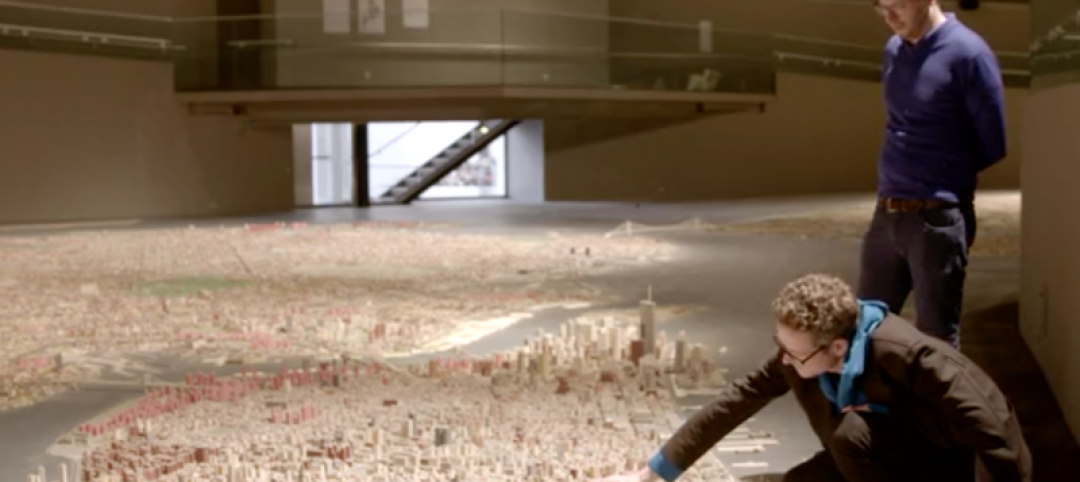
Queens Museum exhibit shows New York City as it could have been
The installation will showcase 200 years worth of unrealized Big Apple projects via original drawings, renderings, newly commissioned models, and 3D visualizations.

Education Facilities | May 22, 2017
Educational design taking lessons from tech firms
Recently, in educational design, we have seen a trend toward more flexible learning spaces.

Architects | May 16, 2017
Architecture that helps children fall in love with the environment
The coming decades present a major ecological challenge... so let’s encourage the next generation to do something about it!

AEC Tech | May 11, 2017
Accelerate Live!: Social media reactions from BD+C's AEC innovation conference
BD+C's inaugural Accelerate Live! innovation conference took place May 11, in Chicago.


