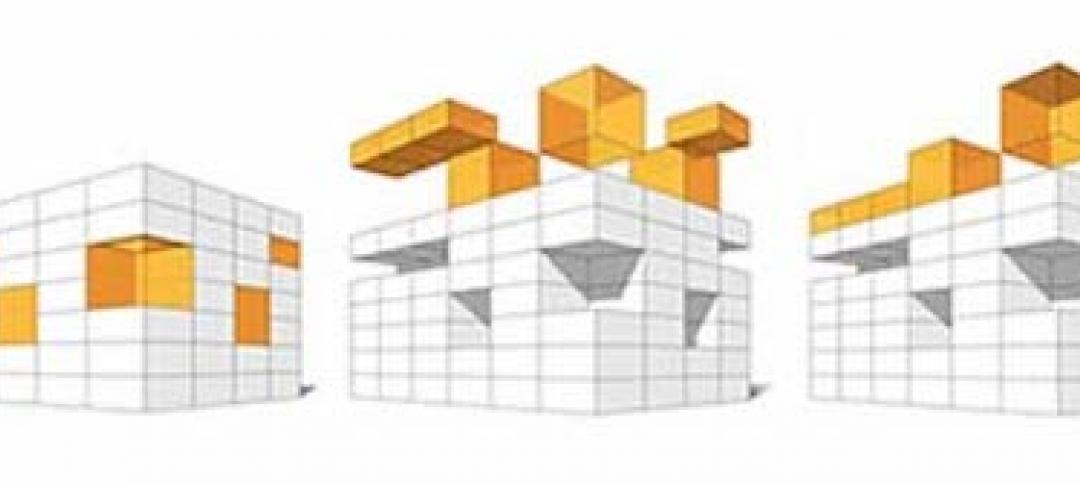
We are surrounded by data.
The sheer volume of data available to educational institutions today is unprecedented. In many cases data that isn’t already accessible, can be either acquired or generated. This abundance of big data, while very helpful, does not necessarily provide the answers K-12 or higher education institutions are looking for nor does it directly translate into solutions for their design problems.
Dynamic trends are a concurrent challenge for many institutions. Pedagogical approaches are currently shifting away from the traditional teacher-centered models to become more learner-centered and reliant on collaboration. Emerging technology is transforming all sectors of education by facilitating quicker transfer of information and remote collaboration. In response to these changes, educational spaces are evolving to facilitate multiple pedagogies. The physical teaching/learning/collaborating environments we create today will inevitably outlast current users and therefore must possess a degree of flexibility that allows them to adapt to the changes ahead.
In gathering this constant flow of data and recognizing the shifting trends, how can educational institutions make informed choices and smart design decisions that lead to higher efficiency and improved control over capital budgets?
Enhanced tools that draw on such data to help achieve maximum output from existing and future campus developments can help. These tools aid in decision-making in many different ways including:
- planning for future growth
- calculating spatial requirements
- conducting suitability assessments for reassigning space and reusing existing building stock
- determining optimum functional and collaborative zoning
- identifying infrastructure issues
- mapping out relevant trends.
Furthermore, data on peer institutions can provide valuable insight into future needs and offer a truly global perspective on ‘best practice.'
Data-driven design is an emerging methodology that connects the built environment to predictive analytics and operational design through computational design. This integrated approach represents a shift in the design process and is proving instrumental in the way we strategize, conduct research and analyze data. Data-driven design is paving the way for innovative design solutions. Through rapid testing of many different scenarios, it is allowing us to explore all available opportunities. Data-driven design can facilitate the engagement of key stakeholders in a design process aiming to create what everyone involved views as a ‘living’ product based on a flow of dynamic data. Taking into account the dynamic nature of data helps tell a more accurate story about a given institution.
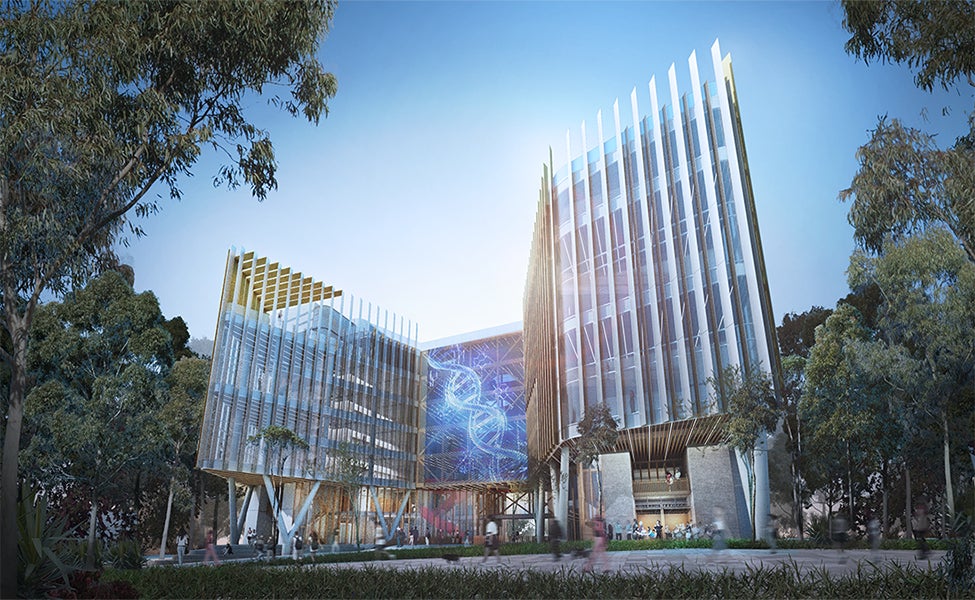
Importantly, data-driven design efforts must be conducted under the assumption that datasets are intrinsically quite complex. For example, proximity is recognized as a key element in analyzing collaboration and by extension innovation. However, proximity is multidimensional in terms of its physical, organizational, social and institutional facets. Data can be leveraged to help develop and analyze colocation and relationship networks which support innovation at different scales — from individual space types such as teaching and research spaces all the way up to the scale of a campus or city centre. Applying the different layers of data available at different scales can help educational institutions understand where and how to catalyze collaboration and innovation.
Innovation, in particular, is influenced by a number of factors we may refer to as ‘predictors of innovation’ that (in addition to proximity) may include: visibility, zoning, demographics, social networks, diversity, organizational culture, transit data and spatial integration, as well as data on the development of informal gathering spaces that we refer to as ‘third places.' Imagine an academic institution that needs to analyze where key industries are clustered alongside funding trends to forecast geographic areas that can host future innovation precincts. Pairing the “predictors of innovation” with geospatial information could facilitate optimized site selection based on industry, economic and education market analysis. Data-driven design makes this type of analysis possible.
A single, consolidated platform with interactive data visualization connected to a portal capturing updated snapshots of relevant data helps different stakeholders keep track of their interests while gaining insights through the data. The ability to curate and to locate different data streams into a single visual environment enables academic, business, research and government entities to better understand trends to strategically develop policies, course-correct and seek opportunities for collaboration.
Harnessing relevant overlapping and intersecting live streams of data and observing their impact over time through a consolidated, interactive dashboard is now within reach. Let’s use the data and plan smarter.
More from Author
HDR | Jun 30, 2022
Adopting a regenerative design mindset
To help address the current climate emergency, a new way of thinking across the entire architecture, engineering and construction industry is imperative.
HDR | Jan 11, 2022
Designing for health sciences education: supporting student well-being
While student and faculty health and well-being should be a top priority in all spaces within educational facilities, this article will highlight some key considerations.
HDR | Sep 28, 2021
Designing for health sciences education: Specialty instruction and human anatomy labs
It is a careful balance within any educational facility to provide both multidisciplinary, multiuse spaces and special-use spaces that serve particular functions.
HDR | Aug 20, 2021
Prioritizing children’s perspectives with play-based design charrettes
Every effort is made to assure that captured insights and observations are authentically from the children.
HDR | Sep 25, 2020
Performance-based textile cleaning and disinfection in the age of COVID-19
It is essential for both designers and environmental services to know the active ingredient(s) of the cleaning products being used within the facility.
HDR | Jan 27, 2020
Elevating the human experience in public realm infrastructure
Understanding the complexities of a community by pairing quantitative data and human needs.
HDR | Oct 2, 2019
Why mass timber?
In a world where the construction industry is responsible for 40% to 50% of CO2 emissions, renewable materials, such as wood, can help mitigate the rate of global warming.
HDR | Aug 23, 2019
5 converging trends for healthcare's future
Our solutions to both today’s and tomorrow’s challenges lie at the convergence of technologies, industries, and types of care.
HDR | Dec 18, 2018
Redesigning the intergenerational village: Innovative solutions for communities and homes of the future
Social sustainability has become a central concern in terms of its effect that spans generations.

