The majority of commercial and industrial contractors are confident about sales growth, profits and staffing levels heading into 2018, according to the latest Associated Builders and Contractors (ABC) Construction Confidence Index (CCI). Despite rising construction labor and materials costs, 55% of contractors expect their profit margins to expand in the first half of 2018.
“There are many reasons for confidence among the nation’s construction firm leaders,” said ABC Chief Economist Anirban Basu. “American wealth has never been greater in absolute terms as the economy experiences faster wage growth, surging equity markets and rising home values. Consumer confidence is at a 17-year high, while unemployment is at a 17-year low.
“Despite the completion of approximately eight and a half years of economic recovery, both inflation and interest rates remain low,” said Basu. “The combination of elevated wealth and confidence with low borrowing costs drives spending and investment, which supports higher demand for construction services.”
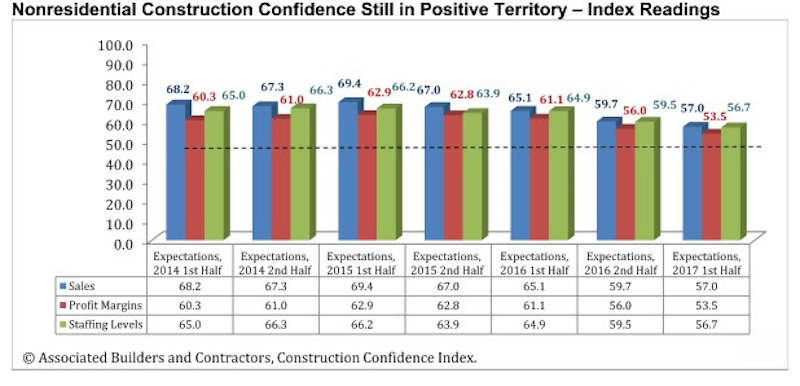
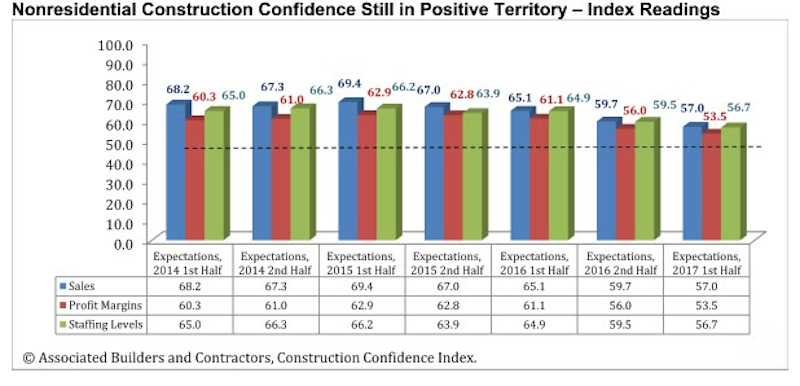
All three diffusion indices in the survey remain above the threshold of 50, which signals ongoing optimism.
The CCI for sales expectations fell from 59.7 to 57;
The CCI for profit margin expectations fell from 56 to 53.5;
The CCI for staffing levels fell from 59.5 to 56.7.
In recent quarters, certain commercial segments have been prone to generate especially large increases in construction spending. These include lodging, office and amusement/recreation. Therefore, commercial contractors are particularly upbeat. Contractors whose businesses rely more heavily on public work remain less ebullient.
The following chart reflects the distribution of responses to ABC’s most recent surveys.

Related Stories
Senior Living Design | May 9, 2017
Designing for a future of limited mobility
There is an accessibility challenge facing the U.S. An estimated 1 in 5 people will be aged 65 or older by 2040.
Industry Research | May 4, 2017
How your AEC firm can go from the shortlist to winning new business
Here are four key lessons to help you close more business.
Engineers | May 3, 2017
At first buoyed by Trump election, U.S. engineers now less optimistic about markets, new survey shows
The first quarter 2017 (Q1/17) of ACEC’s Engineering Business Index (EBI) dipped slightly (0.5 points) to 66.0.
Market Data | May 2, 2017
Nonresidential Spending loses steam after strong start to year
Spending in the segment totaled $708.6 billion on a seasonally adjusted, annualized basis.
Market Data | May 1, 2017
Nonresidential Fixed Investment surges despite sluggish economic in first quarter
Real gross domestic product (GDP) expanded 0.7 percent on a seasonally adjusted annualized rate during the first three months of the year.
Industry Research | Apr 28, 2017
A/E Industry lacks planning, but still spending large on hiring
The average 200-person A/E Firm is spending $200,000 on hiring, and not budgeting at all.
Market Data | Apr 19, 2017
Architecture Billings Index continues to strengthen
Balanced growth results in billings gains in all regions.
Market Data | Apr 13, 2017
2016’s top 10 states for commercial development
Three new states creep into the top 10 while first and second place remain unchanged.
Market Data | Apr 6, 2017
Architecture marketing: 5 tools to measure success
We’ve identified five architecture marketing tools that will help your firm evaluate if it’s on the track to more leads, higher growth, and broader brand visibility.
Market Data | Apr 3, 2017
Public nonresidential construction spending rebounds; overall spending unchanged in February
The segment totaled $701.9 billion on a seasonally adjusted annualized rate for the month, marking the seventh consecutive month in which nonresidential spending sat above the $700 billion threshold.


