A typical change for construction starts between February and March is around +2.5%. This year, however, dwarfed that, as commercial construction starts climbed 18% from February to March to $28.5 billion, Construction Market Data reports. This is a significant spike even when compared to the typical March to April jump of 12%.
While the number of starts in March 2016 was not much different from March 2015 (+1.6 percent), the number of starts over the first three months of 2016 was 9.8% higher than the first quarter of 2015. The report also notes that February’s starts underwent an upward revision from $19.1 billion to 24.1 billion. The largest adjustments occurred in the structure categories of parking garages, private office buildings, and hospitals/clinics.
The construction sector added 37,000 jobs in March, which is the largest gain so far this year. The first three months of the year have seen an average gain of 25,000 jobs, or an increase of 7.1 percent compared to the 23,000 job-per-month average in Q1 2015. The year-over-year employment in construction for March was 4.7 percent, much faster than the pace for all jobs in the economy. March’s jobless rate for the construction sector was 8.7 percent, not great, but an improvement of March 2015’s 9.5 percent.
Among the types of construction that make up nonresidential building, commercial structures and institutional structures saw the largest change between the first quarter of 2016 and the first quarter of 2015 at +19.9% and +19.5% respectively. Heavy engineering has seen a smaller increase at 5.8%. Meanwhile, industrial construction dropped 59.3%.
Private office buildings accounted for the majority of construction starts in the commercial category with a total of $6.059 billion in the first quarter. Among institutional structures, school and college starts have been responsible for over half of the category’s construction so far with a total of $13.426 billion. Roads and bridges made up over a third of the heavy engineering category with $10.967 billion.
The South and the West saw the largest increases in commercial construction between first quarter 2015 and first quarter 2016 while the Midwest and Northeast saw regressions. The West was up 27.6% from 2015 and the South was up 18%. The Midwest dropped 9.1% and the northeast dropped 6.6%. On the whole, the U.S. has seen a 9.8% increase between 2015 and 2016 so far.
Overall, nonresidential building and engineering/civil work accounts for 62% of total construction in the country with residential activity accounting for 38%.
All of the starts figures found throughout CMD’s report are not seasonally adjusted or altered for inflation. They are expressed in ‘current’ as opposed to ‘constant’ dollars.
To read the report in its entirety and to view accompanying graphs, click here.
Related Stories
Multifamily Housing | Apr 4, 2023
Acing your multifamily housing amenities for the modern renter
Eighty-seven percent of residents consider amenities when signing or renewing a lease. Here are three essential amenity areas to focus on, according to market research and trends.
Sustainability | Apr 4, 2023
NIBS report: Decarbonizing the U.S. building sector will require massive, coordinated effort
Decarbonizing the building sector will require a massive, strategic, and coordinated effort by the public and private sectors, according to a report by the National Institute of Building Sciences (NIBS).
Multifamily Housing | Mar 24, 2023
Average size of new apartments dropped sharply in 2022
The average size of new apartments in 2022 dropped sharply in 2022, as tracked by RentCafe. Across the U.S., the average new apartment size was 887 sf, down 30 sf from 2021, which was the largest year-over-year decrease.
Multifamily Housing | Mar 14, 2023
Multifamily housing rent rates remain flat in February 2023
Multifamily housing asking rents remained the same for a second straight month in February 2023, at a national average rate of $1,702, according to the new National Multifamily Report from Yardi Matrix. As the economy continues to adjust in the post-pandemic period, year-over-year growth continued its ongoing decline.
AEC Tech | Mar 14, 2023
Skanska tests robots to keep construction sites clean
What if we could increase consistency and efficiency with housekeeping by automating this process with a robot? Introducing: Spot.
Industry Research | Mar 9, 2023
Construction labor gap worsens amid more funding for new infrastructure, commercial projects
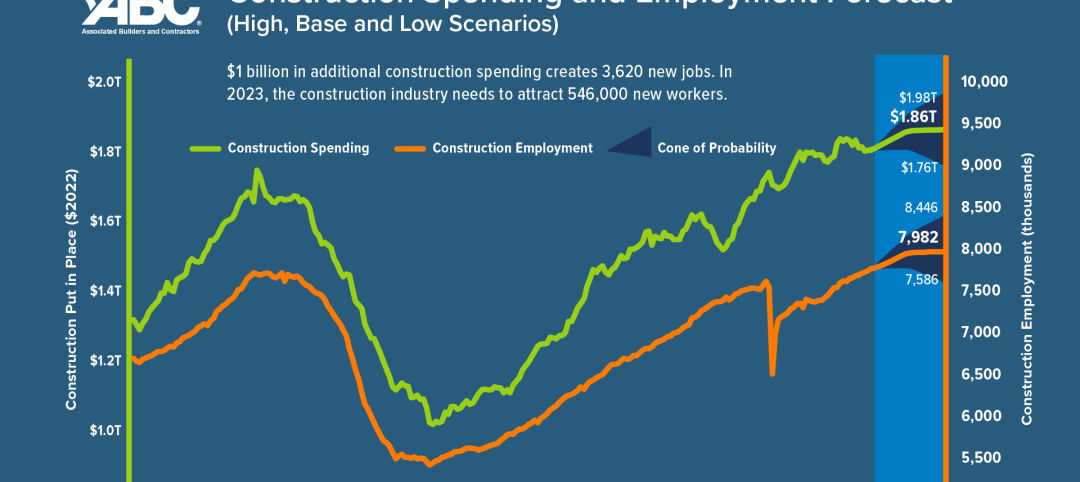
The U.S. construction industry needs to attract an estimated 546,000 additional workers on top of the normal pace of hiring in 2023 to meet demand for labor, according to a model developed by Associated Builders and Contractors. The construction industry averaged more than 390,000 job openings per month in 2022.
Industry Research | Mar 2, 2023
Watch: Findings from Gensler's latest workplace survey of 2,000 office workers
Gensler's Janet Pogue McLaurin discusses the findings in the firm's 2022 Workplace Survey, based on responses from more than 2,000 workers in 10 industry sectors.
Architects | Feb 24, 2023
7 takeaways from HKS’s yearlong study on brain health in the workplace
Managing distractions, avoiding multitasking, and cognitive training are key to staff wellbeing and productivity, according to a yearlong study of HKS employees in partnership with the University of Texas at Dallas’ Center for BrainHealth.
Office Buildings | Feb 9, 2023
Post-Covid Manhattan office market rebound gaining momentum
Office workers in Manhattan continue to return to their workplaces in sufficient numbers for many of their employers to maintain or expand their footprint in the city, according to a survey of more than 140 major Manhattan office employers conducted in January by The Partnership for New York City.
Giants 400 | Feb 9, 2023
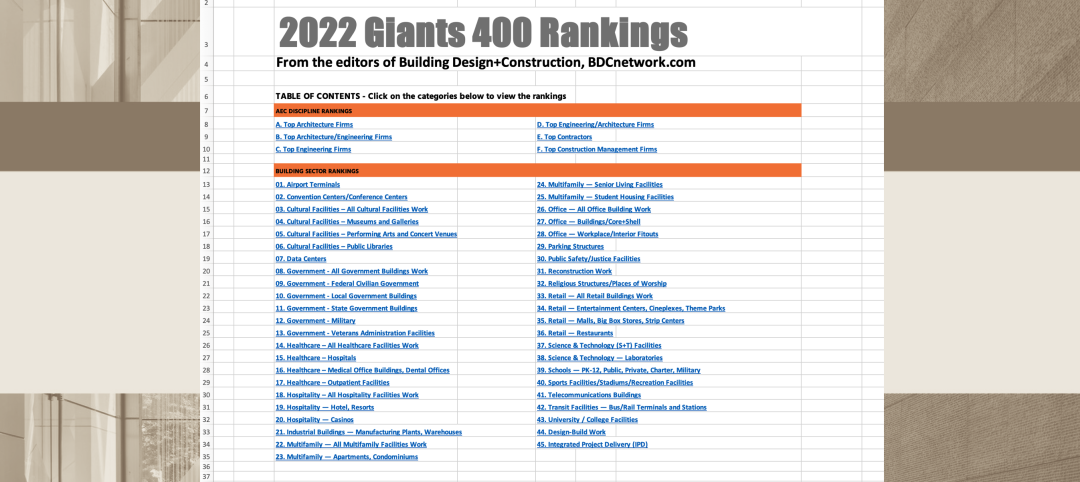
New Giants 400 download: Get the complete at-a-glance 2022 Giants 400 rankings in Excel
See how your architecture, engineering, or construction firm stacks up against the nation's AEC Giants. For more than 45 years, the editors of Building Design+Construction have surveyed the largest AEC firms in the U.S./Canada to create the annual Giants 400 report. This year, a record 519 firms participated in the Giants 400 report. The final report includes 137 rankings across 25 building sectors and specialty categories.


