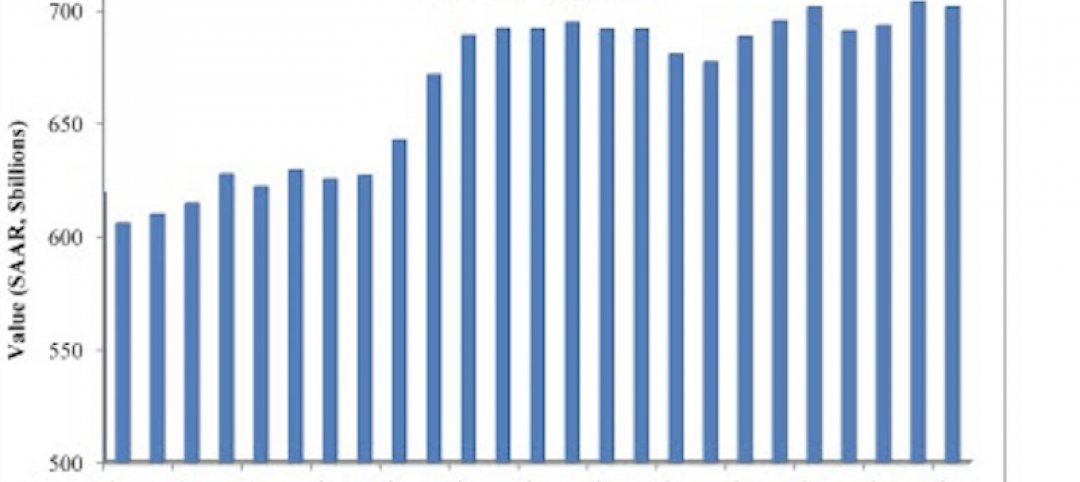
A typical change for construction starts between February and March is around +2.5%. This year, however, dwarfed that, as commercial construction starts climbed 18% from February to March to $28.5 billion, Construction Market Data reports. This is a significant spike even when compared to the typical March to April jump of 12%.
While the number of starts in March 2016 was not much different from March 2015 (+1.6 percent), the number of starts over the first three months of 2016 was 9.8% higher than the first quarter of 2015. The report also notes that February’s starts underwent an upward revision from $19.1 billion to 24.1 billion. The largest adjustments occurred in the structure categories of parking garages, private office buildings, and hospitals/clinics.
The construction sector added 37,000 jobs in March, which is the largest gain so far this year. The first three months of the year have seen an average gain of 25,000 jobs, or an increase of 7.1 percent compared to the 23,000 job-per-month average in Q1 2015. The year-over-year employment in construction for March was 4.7 percent, much faster than the pace for all jobs in the economy. March’s jobless rate for the construction sector was 8.7 percent, not great, but an improvement of March 2015’s 9.5 percent.
Among the types of construction that make up nonresidential building, commercial structures and institutional structures saw the largest change between the first quarter of 2016 and the first quarter of 2015 at +19.9% and +19.5% respectively. Heavy engineering has seen a smaller increase at 5.8%. Meanwhile, industrial construction dropped 59.3%.
Private office buildings accounted for the majority of construction starts in the commercial category with a total of $6.059 billion in the first quarter. Among institutional structures, school and college starts have been responsible for over half of the category’s construction so far with a total of $13.426 billion. Roads and bridges made up over a third of the heavy engineering category with $10.967 billion.
The South and the West saw the largest increases in commercial construction between first quarter 2015 and first quarter 2016 while the Midwest and Northeast saw regressions. The West was up 27.6% from 2015 and the South was up 18%. The Midwest dropped 9.1% and the northeast dropped 6.6%. On the whole, the U.S. has seen a 9.8% increase between 2015 and 2016 so far.
Overall, nonresidential building and engineering/civil work accounts for 62% of total construction in the country with residential activity accounting for 38%.
All of the starts figures found throughout CMD’s report are not seasonally adjusted or altered for inflation. They are expressed in ‘current’ as opposed to ‘constant’ dollars.
To read the report in its entirety and to view accompanying graphs, click here.
Related Stories
Market Data | Oct 11, 2016
Building design revenue topped $28 billion in 2015
Growing profitability at architecture firms has led to reinvestment and expansion
Market Data | Oct 4, 2016
Nonresidential spending slips in August
Public sector spending is declining faster than the private sector.
Industry Research | Oct 3, 2016
Structure Tone survey shows cost is still a major barrier to building green
Climate change, resilience and wellness are also growing concerns.
Industry Research | Sep 28, 2016
Worldwide hotel construction shows modest year-over-year growth
Overall construction for hotel projects is up, but the current number of hotels currently being built has dipped slightly from one year ago.
Industry Research | Sep 27, 2016
Sterling Risk Sentiment Index indicates risk exposure perception remains stable in construction industry
Nearly half (45%) of those polled say election year uncertainty has a negative effect on risk perception in the construction market.
Industry Research | Sep 21, 2016
The global penetration of smart meters is expected to reach approximately 53% by the end of 2025
Large-scale smart meter deployments are underway across Western Europe, while new deployments continue among later adopters in the United States.
Industry Research | Sep 12, 2016
Evidence linking classroom design to improved learning mounts
A study finds the impact can be as much as 25% per year.
Healthcare Facilities | Sep 6, 2016
Chicago Faucets releases white paper: Reducing the risk of HAIs in healthcare facilities
The white paper discusses in detail four options used to mitigate transmission of waterborne bacteria
Market Data | Sep 2, 2016
Nonresidential spending inches lower in July while June data is upwardly revised to eight-year record
Nonresidential construction spending has been suppressed over the last year or so with the primary factor being the lack of momentum in public spending.
Industry Research | Sep 1, 2016
CannonDesign releases infographic to better help universities obtain more R&D funding
CannonDesign releases infographic to better help universities obtain more R&D funding.


