A typical change for construction starts between February and March is around +2.5%. This year, however, dwarfed that, as commercial construction starts climbed 18% from February to March to $28.5 billion, Construction Market Data reports. This is a significant spike even when compared to the typical March to April jump of 12%.
While the number of starts in March 2016 was not much different from March 2015 (+1.6 percent), the number of starts over the first three months of 2016 was 9.8% higher than the first quarter of 2015. The report also notes that February’s starts underwent an upward revision from $19.1 billion to 24.1 billion. The largest adjustments occurred in the structure categories of parking garages, private office buildings, and hospitals/clinics.
The construction sector added 37,000 jobs in March, which is the largest gain so far this year. The first three months of the year have seen an average gain of 25,000 jobs, or an increase of 7.1 percent compared to the 23,000 job-per-month average in Q1 2015. The year-over-year employment in construction for March was 4.7 percent, much faster than the pace for all jobs in the economy. March’s jobless rate for the construction sector was 8.7 percent, not great, but an improvement of March 2015’s 9.5 percent.
Among the types of construction that make up nonresidential building, commercial structures and institutional structures saw the largest change between the first quarter of 2016 and the first quarter of 2015 at +19.9% and +19.5% respectively. Heavy engineering has seen a smaller increase at 5.8%. Meanwhile, industrial construction dropped 59.3%.
Private office buildings accounted for the majority of construction starts in the commercial category with a total of $6.059 billion in the first quarter. Among institutional structures, school and college starts have been responsible for over half of the category’s construction so far with a total of $13.426 billion. Roads and bridges made up over a third of the heavy engineering category with $10.967 billion.
The South and the West saw the largest increases in commercial construction between first quarter 2015 and first quarter 2016 while the Midwest and Northeast saw regressions. The West was up 27.6% from 2015 and the South was up 18%. The Midwest dropped 9.1% and the northeast dropped 6.6%. On the whole, the U.S. has seen a 9.8% increase between 2015 and 2016 so far.
Overall, nonresidential building and engineering/civil work accounts for 62% of total construction in the country with residential activity accounting for 38%.
All of the starts figures found throughout CMD’s report are not seasonally adjusted or altered for inflation. They are expressed in ‘current’ as opposed to ‘constant’ dollars.
To read the report in its entirety and to view accompanying graphs, click here.
Related Stories
Student Housing | Mar 27, 2024
March student housing preleasing in line with last year
Preleasing is still increasing at a historically fast pace, surpassing 61% in February 2024 and marking a 4.5% increase year-over-year.
K-12 Schools | Mar 18, 2024
New study shows connections between K-12 school modernizations, improved test scores, graduation rates
Conducted by Drexel University in conjunction with Perkins Eastman, the research study reveals K-12 school modernizations significantly impact key educational indicators, including test scores, graduation rates, and enrollment over time.
MFPRO+ News | Mar 16, 2024
Multifamily rents stable heading into spring 2024
National asking multifamily rents posted their first increase in over seven months in February. The average U.S. asking rent rose $1 to $1,713 in February 2024, up 0.6% year-over-year.
MFPRO+ News | Mar 12, 2024
Multifamily housing starts and permitting activity drop 10% year-over-year
The past year saw over 1.4 million new homes added to the national housing inventory. Despite the 4% growth in units, both the number of new homes under construction and the number of permits dropped year-over-year.
Multifamily Housing | Mar 4, 2024
Single-family rentals continue to grow in BTR communities
Single-family rentals are continuing to grow in built-to-rent communities. Both rent and occupancy growth have been strong in recent months while remaining a financially viable option for renters.
MFPRO+ News | Mar 2, 2024
Job gains boost Yardi Matrix National Rent Forecast for 2024
Multifamily asking rents broke the five-month streak of sequential average declines in January, rising 0.07 percent, shows a new special report from Yardi Matrix.
K-12 Schools | Feb 29, 2024
Average age of U.S. school buildings is just under 50 years
The average age of a main instructional school building in the United States is 49 years, according to a survey by the National Center for Education Statistics (NCES). About 38% of schools were built before 1970. Roughly half of the schools surveyed have undergone a major building renovation or addition.
MFPRO+ Research | Feb 28, 2024
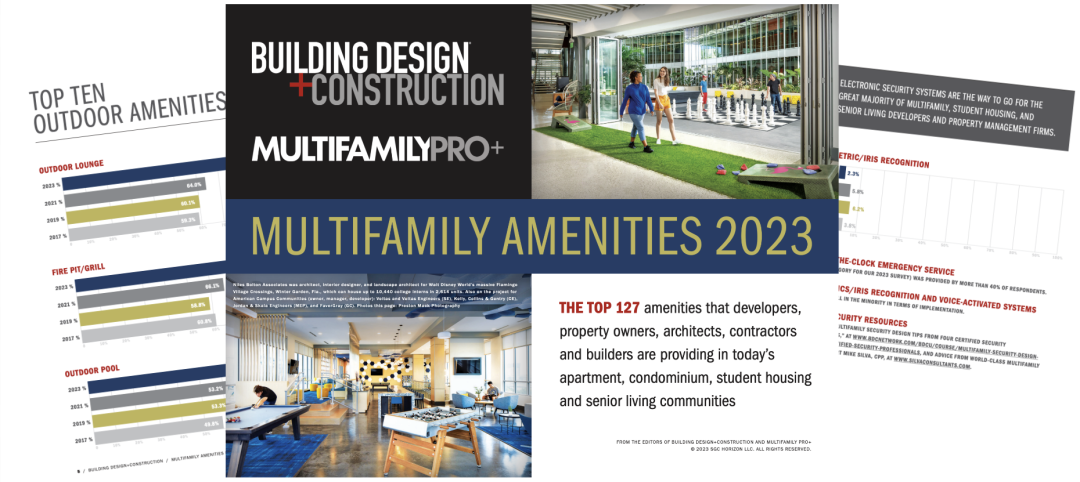
New download: BD+C's 2023 Multifamily Amenities report
New research from Building Design+Construction and Multifamily Pro+ highlights the 127 top amenities that developers, property owners, architects, contractors, and builders are providing in today’s apartment, condominium, student housing, and senior living communities.
MFPRO+ Research | Feb 27, 2024
Most competitive rental markets of early 2024
The U.S. rental market in early 2024 is moderately competitive, with apartments taking an average of 41 days to find tenants, according to the latest RentCafe Market Competitivity Report.
Student Housing | Feb 21, 2024
Student housing preleasing continues to grow at record pace
Student housing preleasing continues to be robust even as rent growth has decelerated, according to the latest Yardi Matrix National Student Housing Report.


