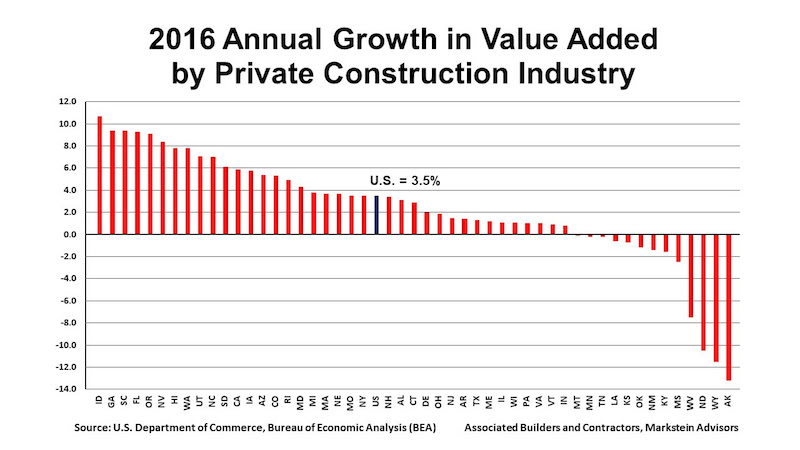
According to a report released today by Associated Builders and Contractors (ABC), the private construction industry’s value added as a percentage of the nation’s real gross domestic product (GDP) rose to 4 in 2016, the highest level since 2009. The report also shows annual growth in real construction spending, which rose 3.5% in 2016. Thirty-seven states benefited from the rise in construction activity in their state, while 13 states experienced a reduction in activity.
“Although the relative impact of the value added by private construction on various state economies varies both among states in a particular year and within a state over time, every state benefits from construction activity,” said Bernard M. Markstein, Ph.D., president and chief economist of Markstein Advisors, who conducted the analysis and prepared the report for ABC. “The increase in that activity in a particular year adds to the income and potential growth of each state. A decline in that activity acts as a drag on a state’s economic performance.”
The 3.5% national increase in real construction spending was a slowdown from the 4.9% increase in 2015. Only 18 states had a greater growth in real construction spending in 2016 compared to 2015.

2016 CONSTRUCTION SPENDING: THE TOP FIVE STATES
The fastest growth was in the West and the South. The first state outside of those two regions in the ranking of construction growth rates is Rhode Island with the 16th largest increase (up 4.9%). In 2016, the top five states for the increase in their real value added from construction in order from highest to lowest were:
1. Idaho, up 10.7%
2. Georgia and South Carolina (tie), up 9.4%
4. Florida, up 9.3%
5. Oregon, up 9.1%
Idaho had the highest percentage contribution from construction, even though state real GDP advanced a respectable, but more modest, 1.8%. Georgia slipped from its number-one ranking in 2015, while South Carolina made a significant jump from 17th to second place.
Florida’s ranking of number four is down from second place in 2015 when its real construction spending was 11.1%. Oregon saw a big improvement from 33rd place in 2015.
2016 CONSTRUCTION SPENDING: THE BOTTOM FIVE STATES
All of the bottom five states suffered from the effects of low energy prices.
46. Mississippi, down 2.5%
47. West Virginia, down 7.5%
48. North Dakota, down 10.5%
49. Wyoming, down 11.5%
50. Alaska, down 13.2%
Alaska has struggled over the last few years. Not only did it experience the largest drop in real private construction spending in 2016, but it also experienced the second largest decrease in state GDP in the nation, down 5%. Real private construction spending has been down every year starting in 2011, except for 2015 (up 0.2%).
Although Wyoming improved its 2016 ranking—it had the largest decrease in 2015 at 6.6%—the 11.5% plunge was an acceleration of a bad outcome. North Dakota had the third largest decline in its real private construction spending in 2016 and 2015, down 10.5% and 4.1%, respectively. However, the state’s growth in construction spending ranked in the top 10 from 2008 through 2014.
West Virginia had the fourth largest decline in its real private construction spending in 2016 and 2015, down 7.5% and 3.1%, respectively. Mississippi’s 2016 decrease represents a slowdown in the decline in construction from 2014 and 2015, when private construction activity fell 8.6% and 5.6%, respectively.
Read the full report here.
Related Stories
Market Data | Jun 22, 2020
7 must reads for the AEC industry today: June 22, 2020
Construction employment rises from April to May in 45 states and the first building in the U.S. designed for post COVID-19 environment.
Market Data | Jun 22, 2020
Construction employment rises from April to May in 45 states, slips in 5
Rebound from April job losses reflects one-shot help from paycheck protection program loans and easing of stay-at-home orders, but cancellations and state and local deficits imply further cuts ahead.
Market Data | Jun 19, 2020
7 must reads for the AEC industry today: June 19, 2020
Brown University's first housing building in three decades and demand for family rentals expected to jump.
Market Data | Jun 18, 2020
New data shows construction activity returning to pre-coronavirus levels in many parts of the country
Association survey and data collected by Procore measure impacts of the pandemic, showing signs of a construction recovery, but labor shortages and project cancellations show industry needs federal help.
Market Data | Jun 18, 2020
AIA releases strategies and illustrations for reducing risk of COVID-19 in schools
For the 2020-21 school year, districts are facing the difficult task of determining if K-12 schools will reopen this fall.
Market Data | Jun 18, 2020
6 must reads for the AEC industry today: June 18, 2020
Northbrook's new cannabis dispensary and America's structural steel industry remains a success story.
Market Data | Jun 17, 2020
6 must reads for the AEC industry today: June 17, 2020
Santa Fe becomes the second city in the world to achieve LEED v4.1 and the megacity is dead.
Market Data | Jun 16, 2020
7 must reads for the AEC industry today: June 16, 2020
Tottenham Hotspur Stadium has its own brewery and workers want policy changes before they return to offices.
Market Data | Jun 15, 2020
International Code Council offers guidance on building re-occupancy for reopening economies
Companies and building managers can access free resources at the Code Council’s Coronavirus Response Center.
Market Data | Jun 12, 2020
6 must reads for the AEC industry today: June 12, 2020
How will museums change in the face of COVID-19 and the patriarch of The Boldt Company dies.


