A new report on office fit-out costs in North America sets out to establish a range of benchmarks for three different office styles, and to suggest what businesses favor which style.
JLL’s project and development services group, which produced the report, used data from more than 2,800 JLL-managed project budgets for over 100 clients from 17 industries in 59 markets throughout the U.S. and Canada.
The goal, says JLL, is to “elevate the conversation” around the real costs of building out various real estate designs. This year’s report includes office layout and space quality components to allow for evaluations of different office layouts, project complexities, and materials. It also provides high, medium, and low allowances for furniture, fixtures, and equipment (FFE); as well as for the installation of audio-visual and security equipment.
The result is an Office Fit Out Matrix, which shows how a handful of dynamics affect fit-out costs. Depending on the market and style, the costs range from $120.18 per sf to $216.07 per sf (see chart).
JLL breaks down these costs by region and metro market. The Northeast and Northwest consistently have higher fit-out costs. The medium costs in New York City are 28.5% above the U.S. average. In San Francisco, a fit-out would cost 22.6% more than the U.S. average. Conversely, the medium fit-out costs in West Palm Beach, Fla., are 15.9% below the national average; in Austin, Texas, 15.3% below.
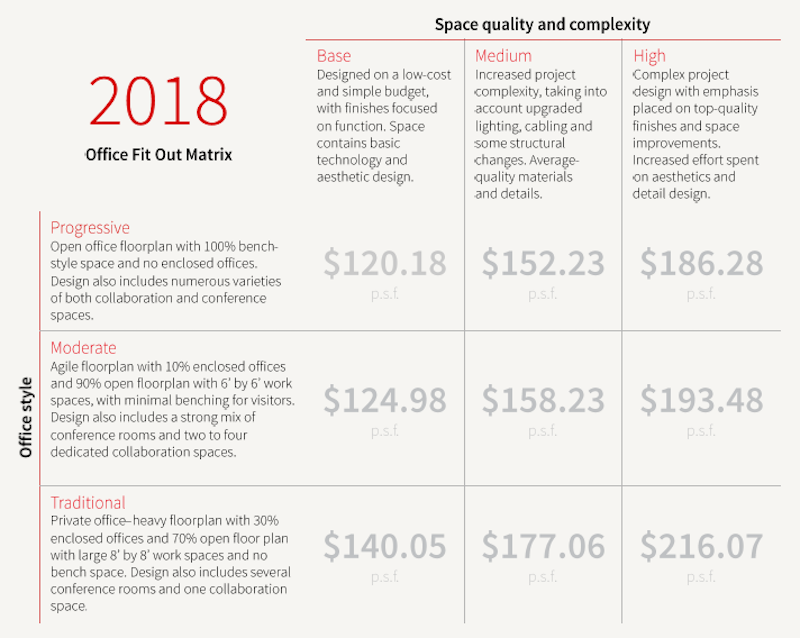
This office fit-out matrix is based on data from over 2,800 project budgets in North America that JLL managed. Image: JLL
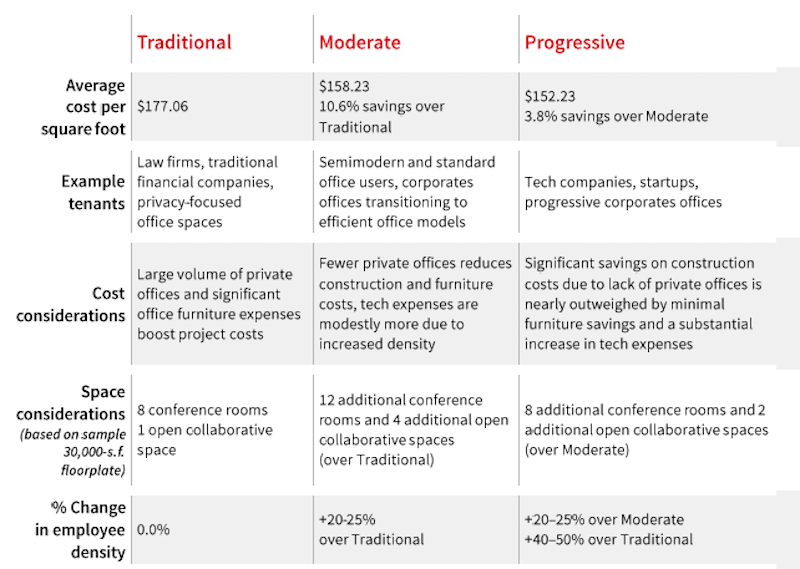
JLL's matrix compares the medium costs for fitting out three different office styles. Image: JLL
Three office styles examined
JLL divides its office fit-out costs along three styles:
• A Traditional office is still the most expensive to fit out. This style has the highest percentage of private office spaces, and typically between 20% and 50% fewer employees than the other two styles. Its FFE costs are the highest among the three styles, too. And tenant factors are “relatively small,” says JLL, because there is less common area. These offices are still favored by law firms, financial services companies, and businesses that focus on privacy with their offices.
JLL observes that some Traditional office styles are introducing lower-partition bench desks.
• A less-expensive fit-out, a Moderate office style features “agile” floorplans, with 10% dedicated to enclosed offices, and the rest of the space open with 6x6-foot workstations and minimal benching and guest space. Moderate offices—which are 20-25% less dense than Progressive office styles—include a healthy mix of conference rooms, and a few multipurpose and collaborative spaces. The hard fit-out costs for the Moderate style are average, but cost efficiencies can be captured by adding more bench-style desks.
• The Progressive office style is distinguished by an open floorplan, 100% of its desk space outfitted as bench-style furniture with zero enclosed spaces. This style’s focus is on activity-based working. Its employee density is 20-50% higher than a Traditional office, and it has double the amount of collaborative and conference spaces. (A standard plan would include 20 conference rooms and seven open collaborative/multi-use spaces.)
JLL points out that Progressive fit-outs generally have higher technology costs, but save money on FFE spending.
Landlords allowing for more upgrades
Last year, nearly 69 million sf of new office space were delivered to the market, but only 47.4% was preleased. JLL’s report observes that landlords are spending more to compete for tenants that are consistently gravitating toward high-quality spaces and assets. Consequently, landlords are offering better tenant improvement packages.
JLL cites several reasons for this trend, including the steady climb in construction costs, which increased on average by 15% last year. Landlords also offer better tenant improvement packages to offset the impact of higher rents.
The national average for tenant improvement allowances was $44 per sf, ranging from $105/sf in Washington D.C. to $28/sf in Nashville.
The report provides detailed snapshots of several markets, such as Austin, one of the country’s dynamic office markets, with robust growth supply. There are 3.1 million sf of new office space in Austin’s pipeline, 36% of which is preleased. The average tenant improvement allowance there last year was $45/sf.
There’s 7 million sf of new office space in the pipeline in San Francisco, where the office vacancy rate is 9.1%, and 68.8% of new space is preleased. The average tenant improvement allowance in San Francisco last year was $60/sf.
Related Stories
Office Buildings | Jan 26, 2015
Seattle gets a peek at Amazon’s latest plans for its downtown complex
The online retailer is seeking permits to build on a fourth city block that would include 835,200 sf of office space.
| Jan 14, 2015
10 change management practices that can ease workplace moves
No matter the level of complexity, workplace change can be a challenge for your client's employees. VOA's Angie Lee breaks down the process of moving offices as efficiently as possible, from creating a "change team" to hosting hard-hat tours.
| Jan 13, 2015
SOM-designed Broadgate Exchange House wins Twenty-five Year Award
Exchange House, an elegant 10-story office building that spans over the merging tracks of London’s Liverpool Street Station, is located in London’s Broadgate Development.
| Jan 9, 2015
10 surprising lessons Perkins+Will has learned about workplace projects
P+W's Janice Barnes shares some of most unexpected lessons from her firm's work on office design projects, including the importance of post-occupancy evaluations and having a cohesive transition strategy for workers.
| Jan 9, 2015
Technology and media tenants, not financial companies, fill up One World Trade Center
The financial sector has almost no presence in the new tower, with creative and media companies, such as magazine publisher Conde Nast, dominating the vast majority of leased space.
| Jan 8, 2015
The future of alternative work spaces: open-access markets, co-working, and in-between spaces
During the past five years, people have begun to actively seek out third places not just to get a day’s work done, but to develop businesses of a new kind and establish themselves as part of a real-time conversation of diverse entrepreneurs, writes Gensler's Shawn Gehle.
Smart Buildings | Jan 7, 2015
Best practices for urban infill development: Embrace the region's character, master the pedestrian experience
If an urban building isn’t grounded in the local region’s character, it will end up feeling generic and out-of-place. To do urban infill the right way, it’s essential to slow down and pay proper attention to the context of an urban environment, writes GS&P's Joe Bucher.
| Jan 6, 2015
Construction permits exceeded $2 billion in Minneapolis in 2014
Two major projects—a new stadium for the Minnesota Vikings NFL team and the city’s Downtown East redevelopment—accounted for about half of the total worth of the permits issued.
| Jan 2, 2015
Construction put in place enjoyed healthy gains in 2014
Construction consultant FMI foresees—with some caveats—continuing growth in the office, lodging, and manufacturing sectors. But funding uncertainties raise red flags in education and healthcare.
| Dec 28, 2014
Robots, drones, and printed buildings: The promise of automated construction
Building Teams across the globe are employing advanced robotics to simplify what is inherently a complex, messy process—construction.


