The United States is leading the way in Energy and Environmental Design (LEED) green buildings, according to new research by Uswitch.com, the comparison and switching service.
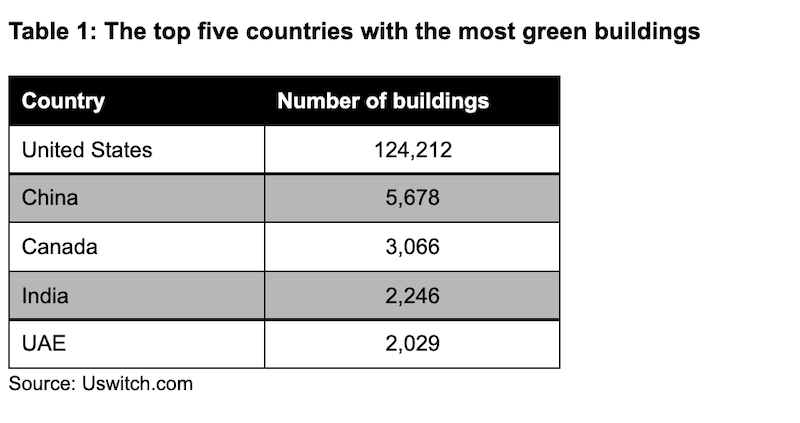
As the country that set up the LEED initiative, the US is a natural leader in constructing green buildings, with 124,200 (124,212) LEED-certified buildings - the most overall in the world. China has over 100,000 fewer buildings than the US, with 5,700 (5,678). However, they still come in second place for the most green buildings. In third place is Canada with just over 3,000 (3,066) green buildings.
The US Green Building Council (USGBC) reports that 40% of worldwide energy usage comes from the construction industry, with it estimated to increase by 1.8% by 2030. With that said, business owners can now achieve LEED-certified buildings, which is an establishment that recognises healthy, highly efficient and cost-saving green buildings.
To put the buildings in each country into perspective, Uswitch compared the numbers to every 100K of the population.
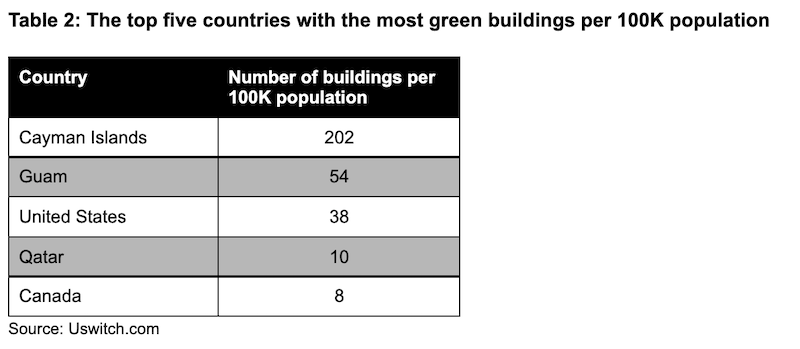
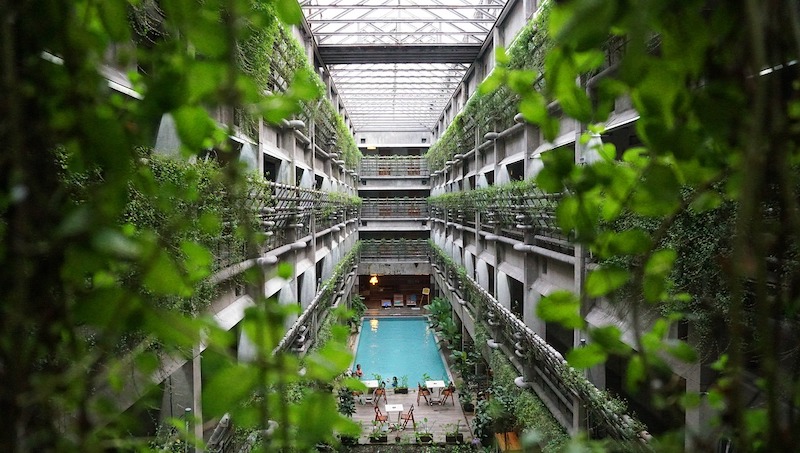
Characteristics of a green building include being in close proximity to public transport to reduce carbon footprint, efficient use of water to reduce the building’s water usage, recycling systems, as well as air cleanliness and noise pollution.
There are different types of buildings that are LEED-rated and are leading the way in sustainability, from the likes of education, healthcare, hospitality, industrial and residential buildings.
If living in a city that is sustainably-aware and is making an effort to reduce carbon emissions is of importance - like it is for many nowadays - the following cities are leading the way with green construction.
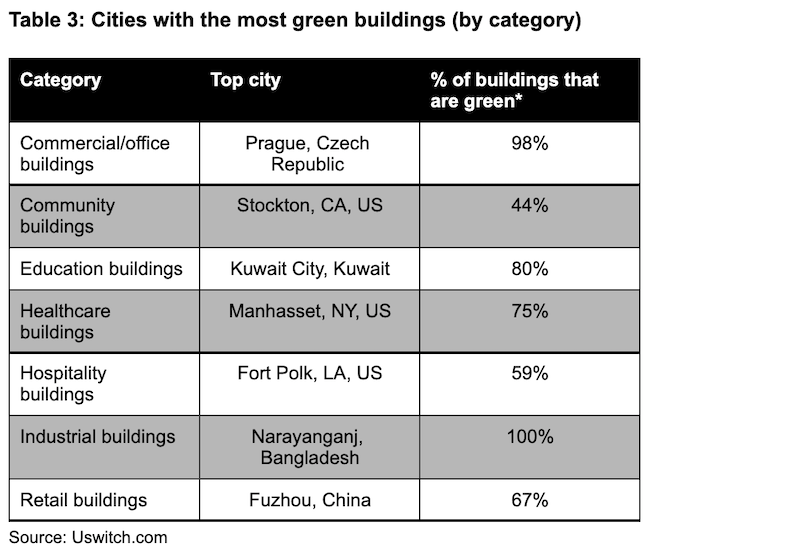
All of the industrial buildings in Narayanganj, Bangladesh, are green-certified. Nearly all (98%) of Prague, Czech Republic’s LEED-certified buildings are used for offices. Following this, 75% of healthcare buildings in Manhasset, United States, are green.
-
Country and city totals were compiled based on the LEED Projects Directory as maintained by the U.S. Green Buildings Council. LEED projects were classified by their end use on the basis of the first use category listed in the "Project Type" field in the Projects Directory database. "Other/Unknown" category incorporates projects that weren't numerous enough to warrant their own category, i.e. "Military" and projects where the type was labeled as "Other" or "Unknown". Projects that were in their planning phase (e.g. designated under LEED-ND), rather than being completed, were excluded from the dataset. Country populations were taken from the World Bank's "Population, Total" indicator. City populations were obtained from Simple Maps "US Cities" and "World Cities" datasets. State populations were taken from the U.S. Census Bureau. Only countries with 50 or more LEED projects were included. Only cities with 20 or more LEED projects were included. LEED projects, where location was listed as "Confidential" or partial, i.e. only indicating country or its subdivision (state, province), but specifying country were included in the country totals, but excluded from city totals. Data was collated in Apr 2021.
-
Source: Gocontractor.com: How does construction impact the environment?
-
Source: Iberdrola.com: The 'green' buildings are leading the way to more sustainable and efficient urban planning
Related Stories
Market Data | Feb 17, 2021
Soaring prices and delivery delays for lumber and steel squeeze finances for construction firms already hit by pandemic
Association officials call for removing tariffs on key materials to provide immediate relief for hard-hit contractors and exploring ways to expand long-term capacity for steel, lumber and other materials,
Market Data | Feb 9, 2021
Construction Backlog and contractor optimism rise to start 2021, according to ABC member survey
Despite the monthly uptick, backlog is 0.9 months lower than in January 2020.
Market Data | Feb 9, 2021
USGBC top 10 states for LEED in 2020
The Top 10 States for LEED green building is based on gross square feet of certified space per person using 2010 U.S. Census data and includes commercial and institutional projects certified in 2020.
Market Data | Feb 8, 2021
Construction employment stalls in January with unemployment rate of 9.4%
New measures threaten to undermine recovery.
Market Data | Feb 4, 2021
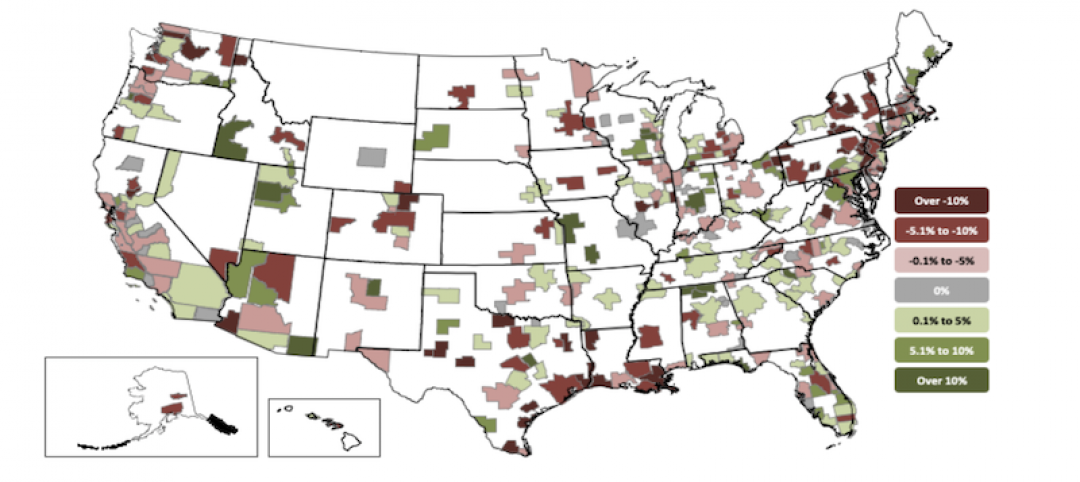
Construction employment declined in 2020 in majority of metro areas
Houston-The Woodlands-Sugar Land and Brockton-Bridgewater-Easton, Mass. have worst 2020 losses, while Indianapolis-Carmel-Anderson, Ind. and Walla Walla, Wash. register largest gains in industry jobs.
Market Data | Feb 3, 2021
Construction spending diverges in December with slump in private nonresidential sector, mixed public work, and boom in homebuilding
Demand for nonresidential construction and public works will decline amid ongoing pandemic concerns.
Market Data | Feb 1, 2021
The New York City market is back on top and leads the U.S. hotel construction pipeline
New York City has the greatest number of projects under construction with 108 projects/19,439 rooms.
Market Data | Jan 29, 2021
Multifamily housing construction outlook soars in late 2020
Exceeds pre-COVID levels, reaching highest mark since 1st quarter 2018.
Market Data | Jan 29, 2021
The U.S. hotel construction pipeline stands at 5,216 projects/650,222 rooms at year-end 2020
At the end of Q4 ‘20, projects currently under construction stand at 1,487 projects/199,700 rooms.
Multifamily Housing | Jan 27, 2021
2021 multifamily housing outlook: Dallas, Miami, D.C., will lead apartment completions
In its latest outlook report for the multifamily rental market, Yardi Matrix outlined several reasons for hope for a solid recovery for the multifamily housing sector in 2021, especially during the second half of the year.


