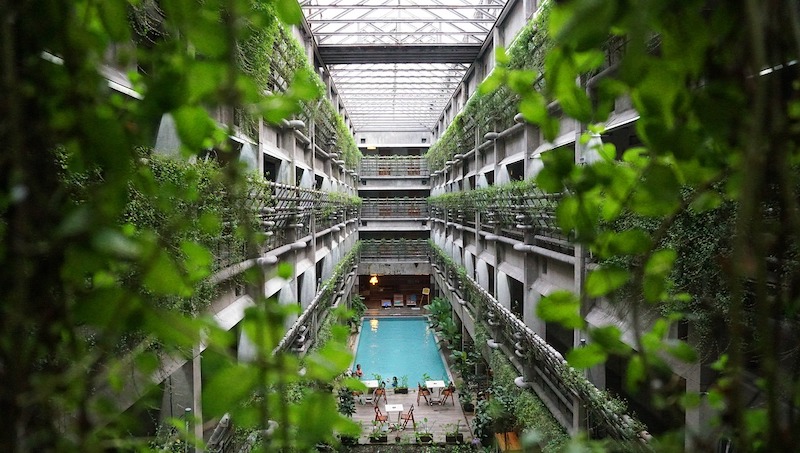
The United States is leading the way in Energy and Environmental Design (LEED) green buildings, according to new research by Uswitch.com, the comparison and switching service.
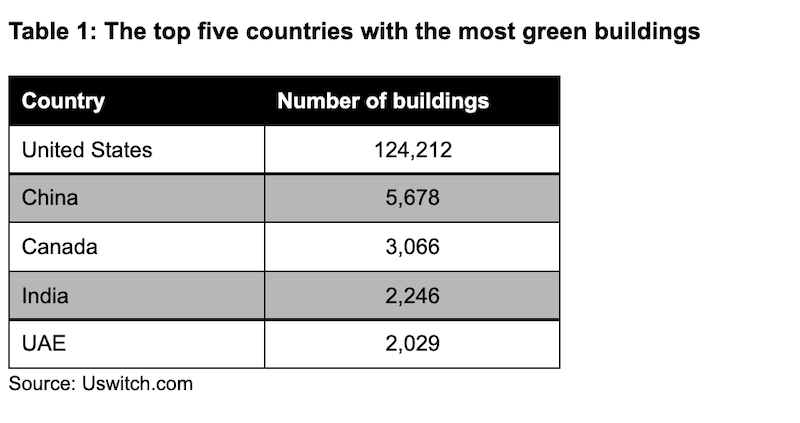
As the country that set up the LEED initiative, the US is a natural leader in constructing green buildings, with 124,200 (124,212) LEED-certified buildings - the most overall in the world. China has over 100,000 fewer buildings than the US, with 5,700 (5,678). However, they still come in second place for the most green buildings. In third place is Canada with just over 3,000 (3,066) green buildings.
The US Green Building Council (USGBC) reports that 40% of worldwide energy usage comes from the construction industry, with it estimated to increase by 1.8% by 2030. With that said, business owners can now achieve LEED-certified buildings, which is an establishment that recognises healthy, highly efficient and cost-saving green buildings.
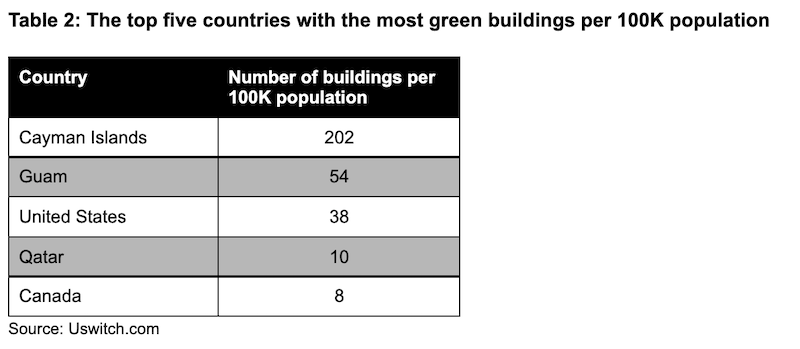
To put the buildings in each country into perspective, Uswitch compared the numbers to every 100K of the population.
Characteristics of a green building include being in close proximity to public transport to reduce carbon footprint, efficient use of water to reduce the building’s water usage, recycling systems, as well as air cleanliness and noise pollution.
There are different types of buildings that are LEED-rated and are leading the way in sustainability, from the likes of education, healthcare, hospitality, industrial and residential buildings.
If living in a city that is sustainably-aware and is making an effort to reduce carbon emissions is of importance - like it is for many nowadays - the following cities are leading the way with green construction.
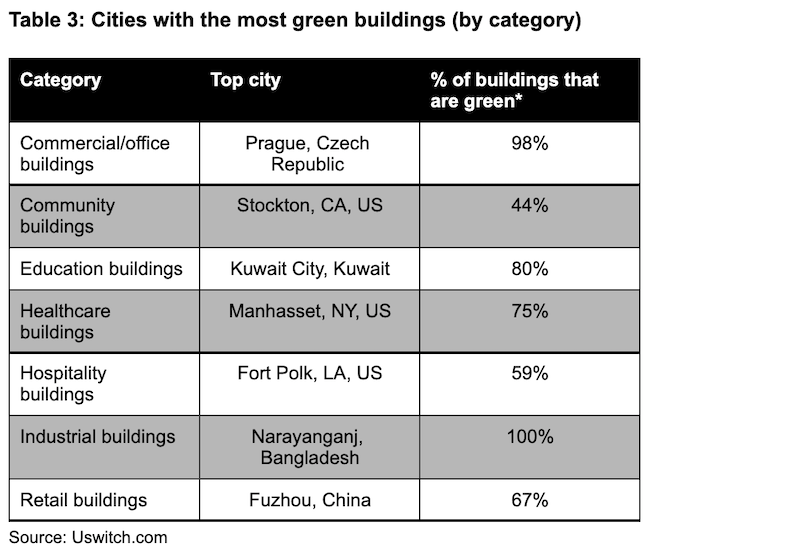
All of the industrial buildings in Narayanganj, Bangladesh, are green-certified. Nearly all (98%) of Prague, Czech Republic’s LEED-certified buildings are used for offices. Following this, 75% of healthcare buildings in Manhasset, United States, are green.
-
Country and city totals were compiled based on the LEED Projects Directory as maintained by the U.S. Green Buildings Council. LEED projects were classified by their end use on the basis of the first use category listed in the "Project Type" field in the Projects Directory database. "Other/Unknown" category incorporates projects that weren't numerous enough to warrant their own category, i.e. "Military" and projects where the type was labeled as "Other" or "Unknown". Projects that were in their planning phase (e.g. designated under LEED-ND), rather than being completed, were excluded from the dataset. Country populations were taken from the World Bank's "Population, Total" indicator. City populations were obtained from Simple Maps "US Cities" and "World Cities" datasets. State populations were taken from the U.S. Census Bureau. Only countries with 50 or more LEED projects were included. Only cities with 20 or more LEED projects were included. LEED projects, where location was listed as "Confidential" or partial, i.e. only indicating country or its subdivision (state, province), but specifying country were included in the country totals, but excluded from city totals. Data was collated in Apr 2021.
-
Source: Gocontractor.com: How does construction impact the environment?
-
Source: Iberdrola.com: The 'green' buildings are leading the way to more sustainable and efficient urban planning
Related Stories
Hotel Facilities | Sep 6, 2017
Marriott has the largest construction pipeline of any franchise company in the U.S.
Marriott has the most rooms currently under construction with 482 Projects/67,434 Rooms.
Market Data | Sep 5, 2017
Nonresidential construction declines again, public and private sector down in July
Weakness in spending was widespread.
Market Data | Aug 29, 2017
Hidden opportunities emerge from construction industry challenges
JLL’s latest construction report shows stability ahead with tech and innovation leading the way.
Market Data | Aug 28, 2017
U.S. hotel construction pipeline is up 7% year-over-year
For the economy, the rate of growth may be low but it’s running on all cylinders.
Market Data | Aug 23, 2017
Architecture Billings Index growth moderates
“The July figures show the continuation of healthy trends in the construction sector of our economy,” said AIA Chief Economist, Kermit Baker.
Architects | Aug 21, 2017
AIA: Architectural salaries exceed gains in the broader economy
AIA’s latest compensation report finds average compensation for staff positions up 2.8% from early 2015.
Market Data | Aug 20, 2017
Some suburban office markets are holding their own against corporate exodus to cities
An analysis of mortgage-backed loans suggests that demand remains relatively steady.
Market Data | Aug 17, 2017
Marcum Commercial Construction Index reports second quarter spending increase in commercial and office construction
Spending in all 12 of the remaining nonresidential construction subsectors retreated on both an annualized and monthly basis.
Industry Research | Aug 11, 2017
NCARB releases latest data on architectural education, licensure, and diversity
On average, becoming an architect takes 12.5 years—from the time a student enrolls in school to the moment they receive a license.
Market Data | Aug 4, 2017
U.S. grand total construction starts growth projection revised slightly downward
ConstructConnect’s quarterly report shows courthouses and sports stadiums to end 2017 with a flourish.


