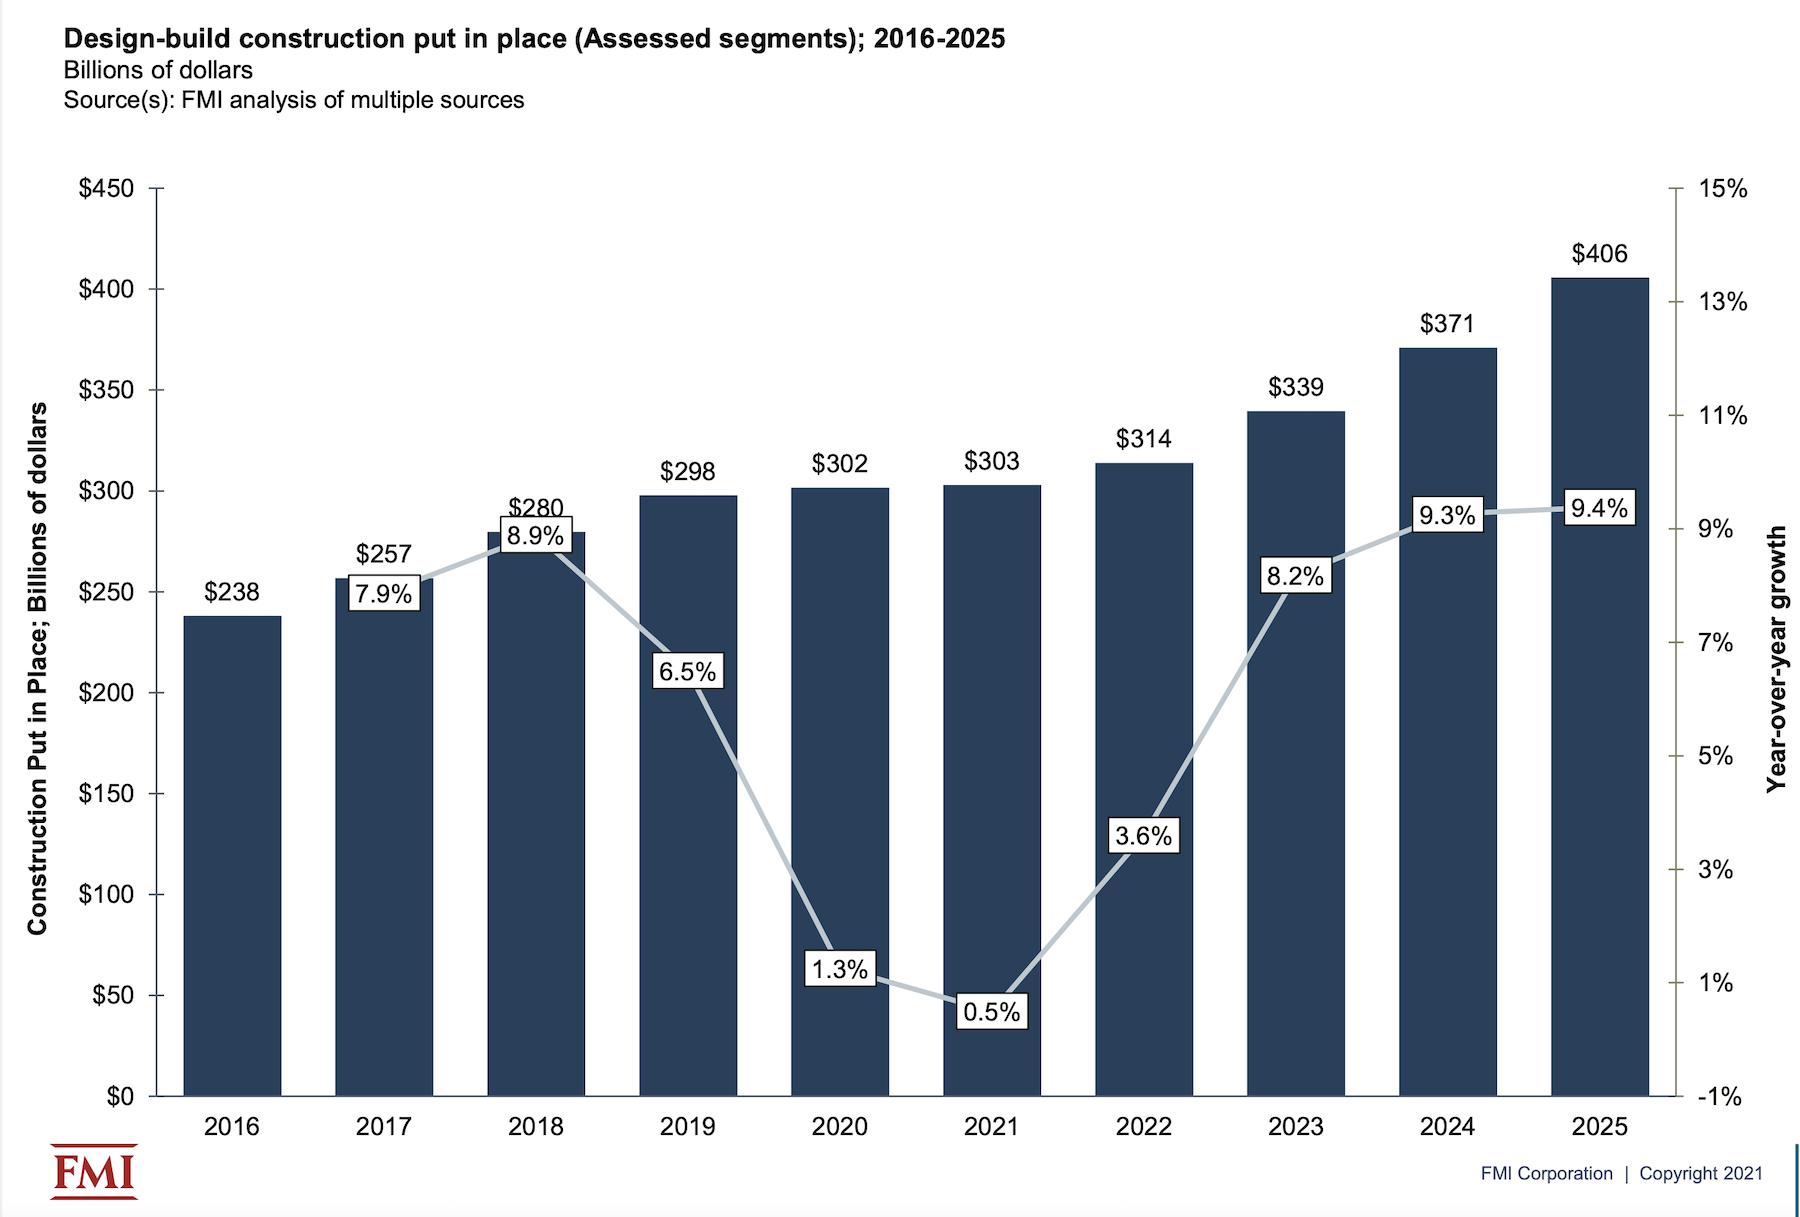
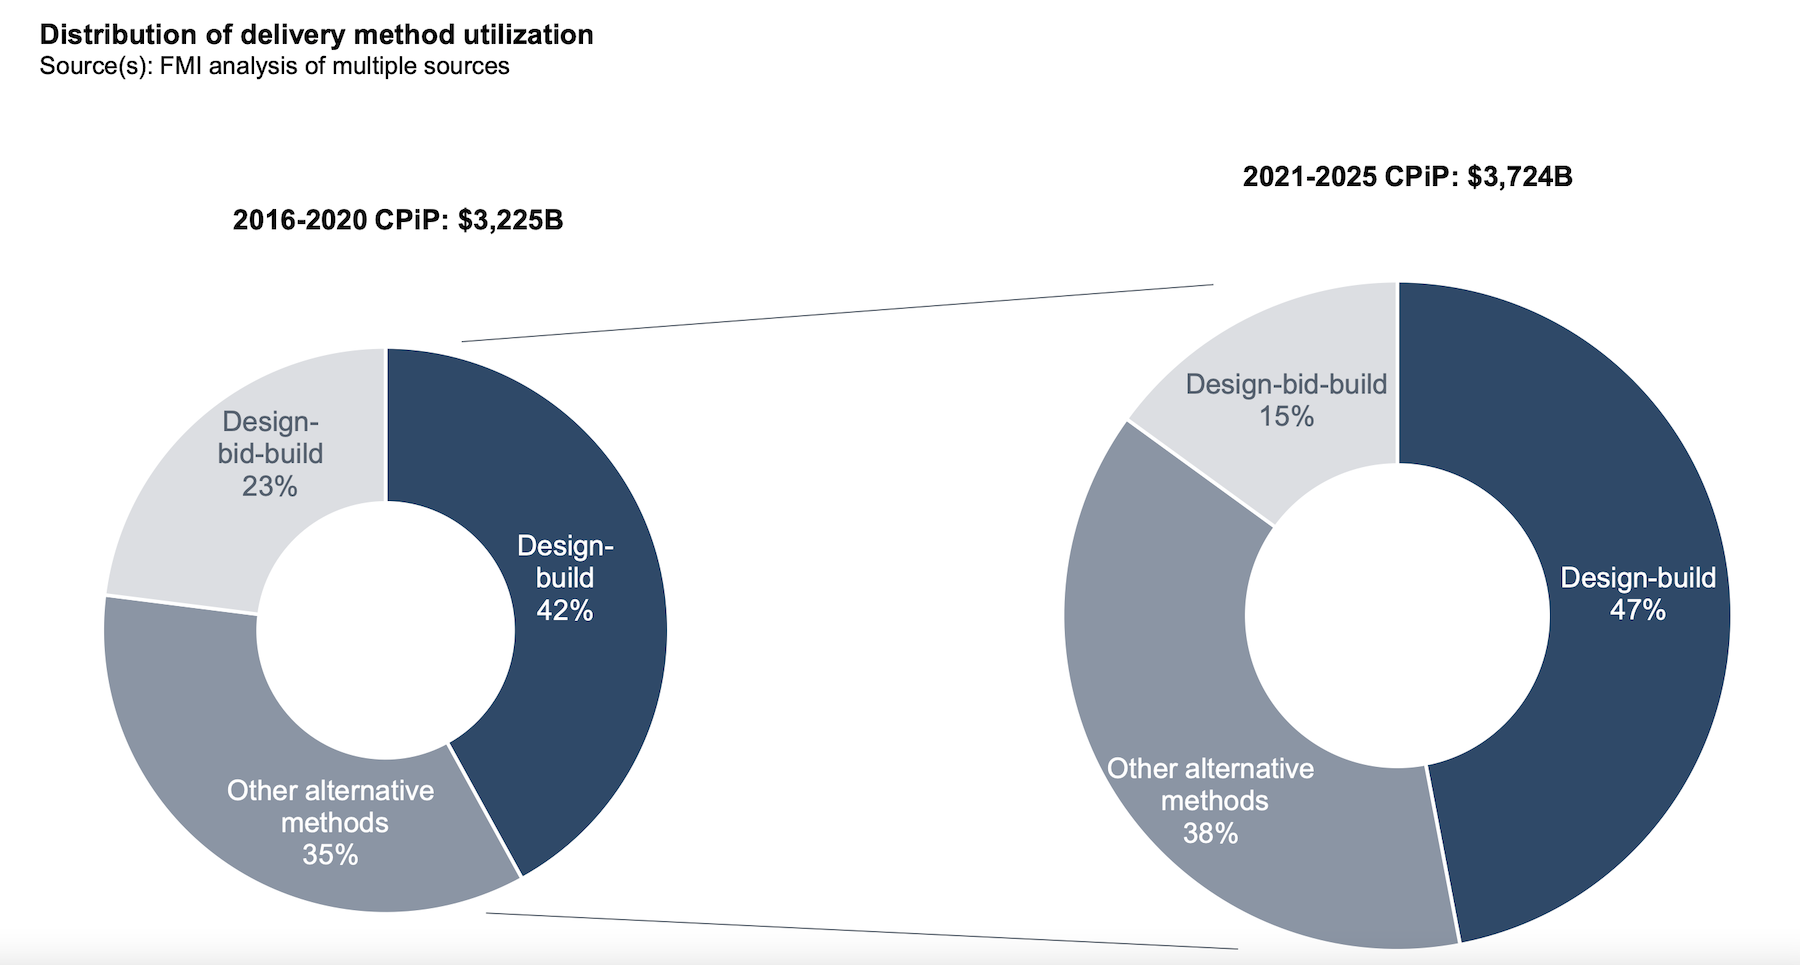
Design-build delivered projects will account for nearly half of all construction spending by 2025, according to the consulting and investment firm FMI’s latest market research on design-built utilization.
FMI’s research for its 50-page report is based on a survey of 279 industry stakeholders and 46 interviews. FMI conducted the study in partnership with the Design-Build Institute of America (DBIA), and piggybacks on research in 2018 that confirmed design-build was no longer just an alternative delivery method, but one that had been embraced by a growing number of owner-developers and their AEC partners.
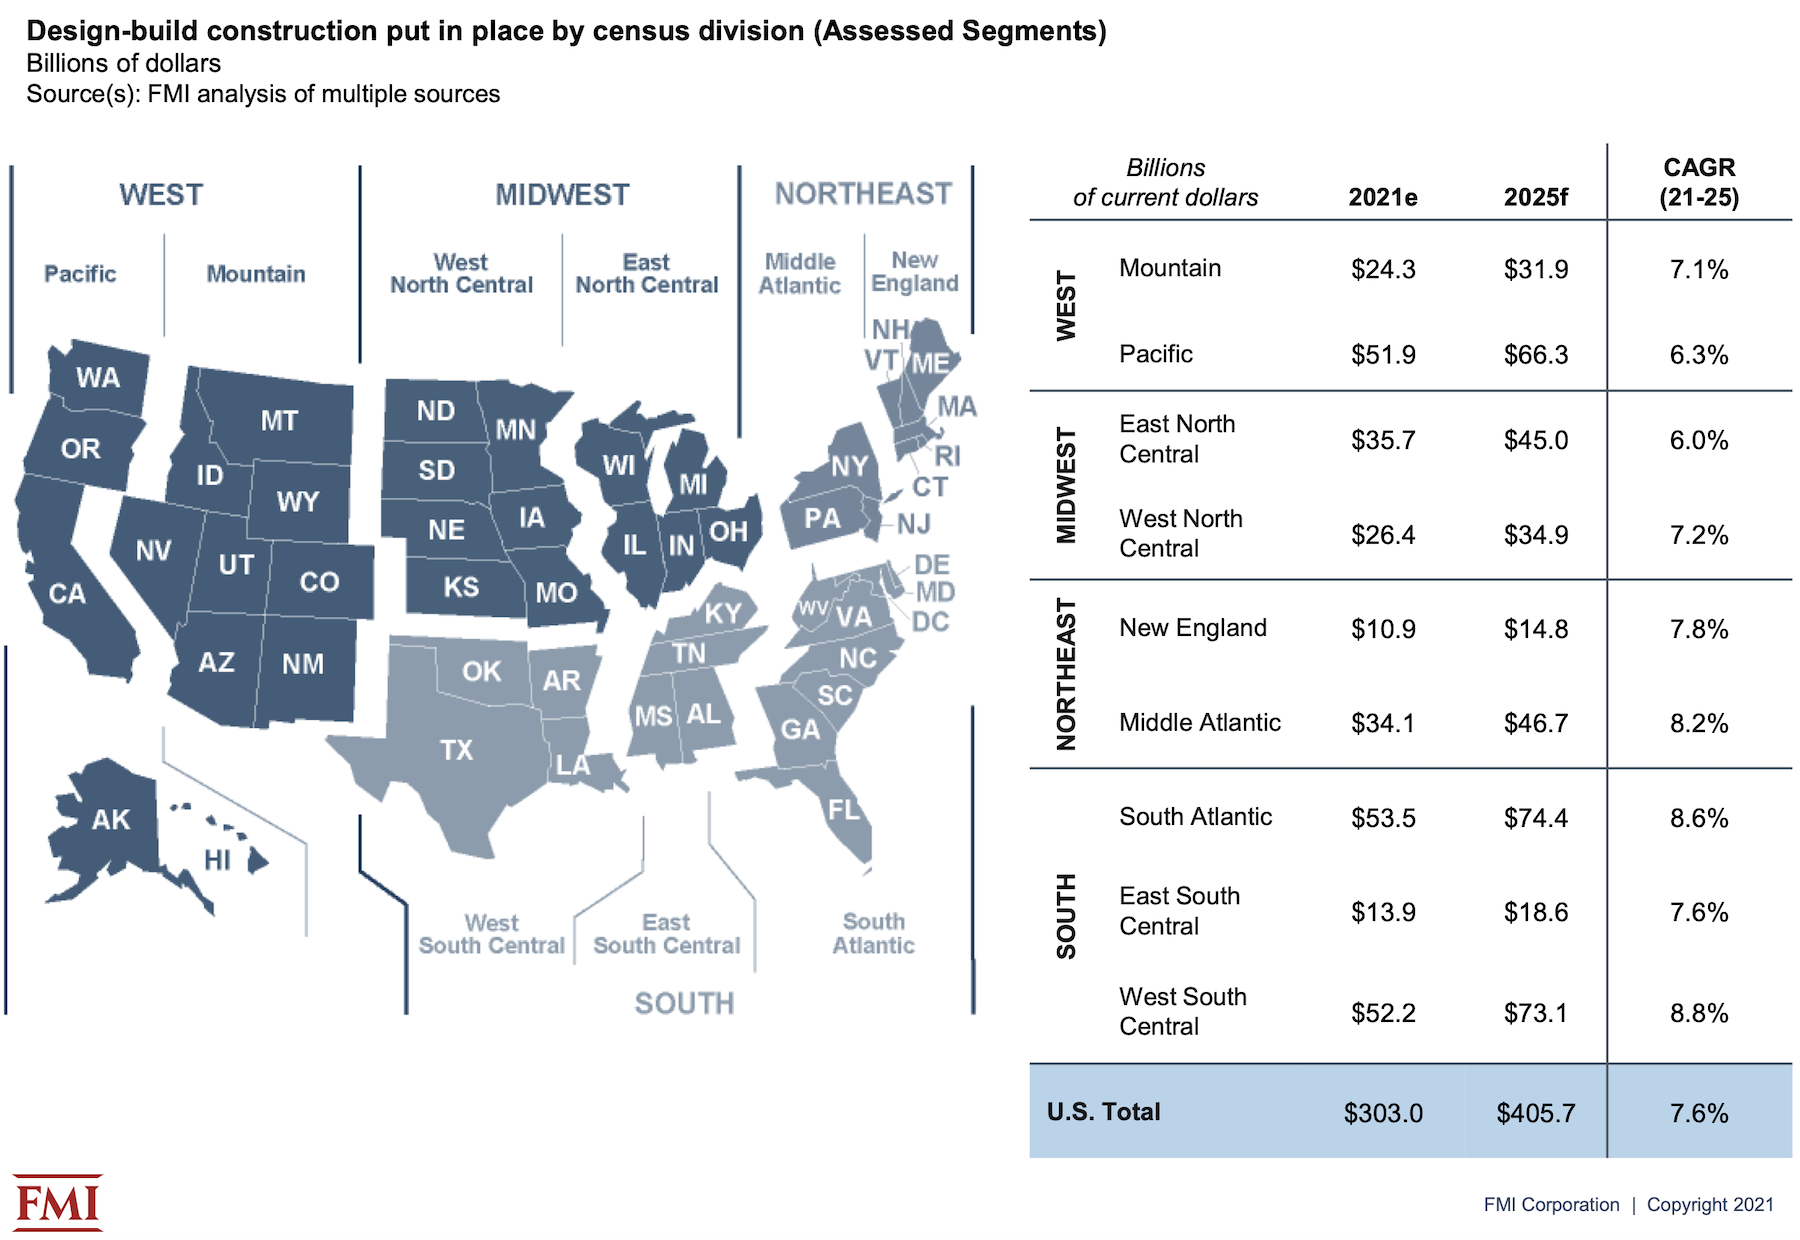
FMI’s latest report, which it releases today, forecasts that spending for design-build construction put in place will grow at a compound annual rate of 7.6% over the years 2021 through 2025, and hit $405.7 billion in 2025, or 47% of total construction spending that year, vs 42% of the total in 2021.
FMI expects the five-year rate of growth to be higher than the national average in the West South Central, South Atlantic, Middle Atlantic, and New England regions.
CERTAIN SECTORS MORE DISPOSED TOWARD DESIGN-BUILD
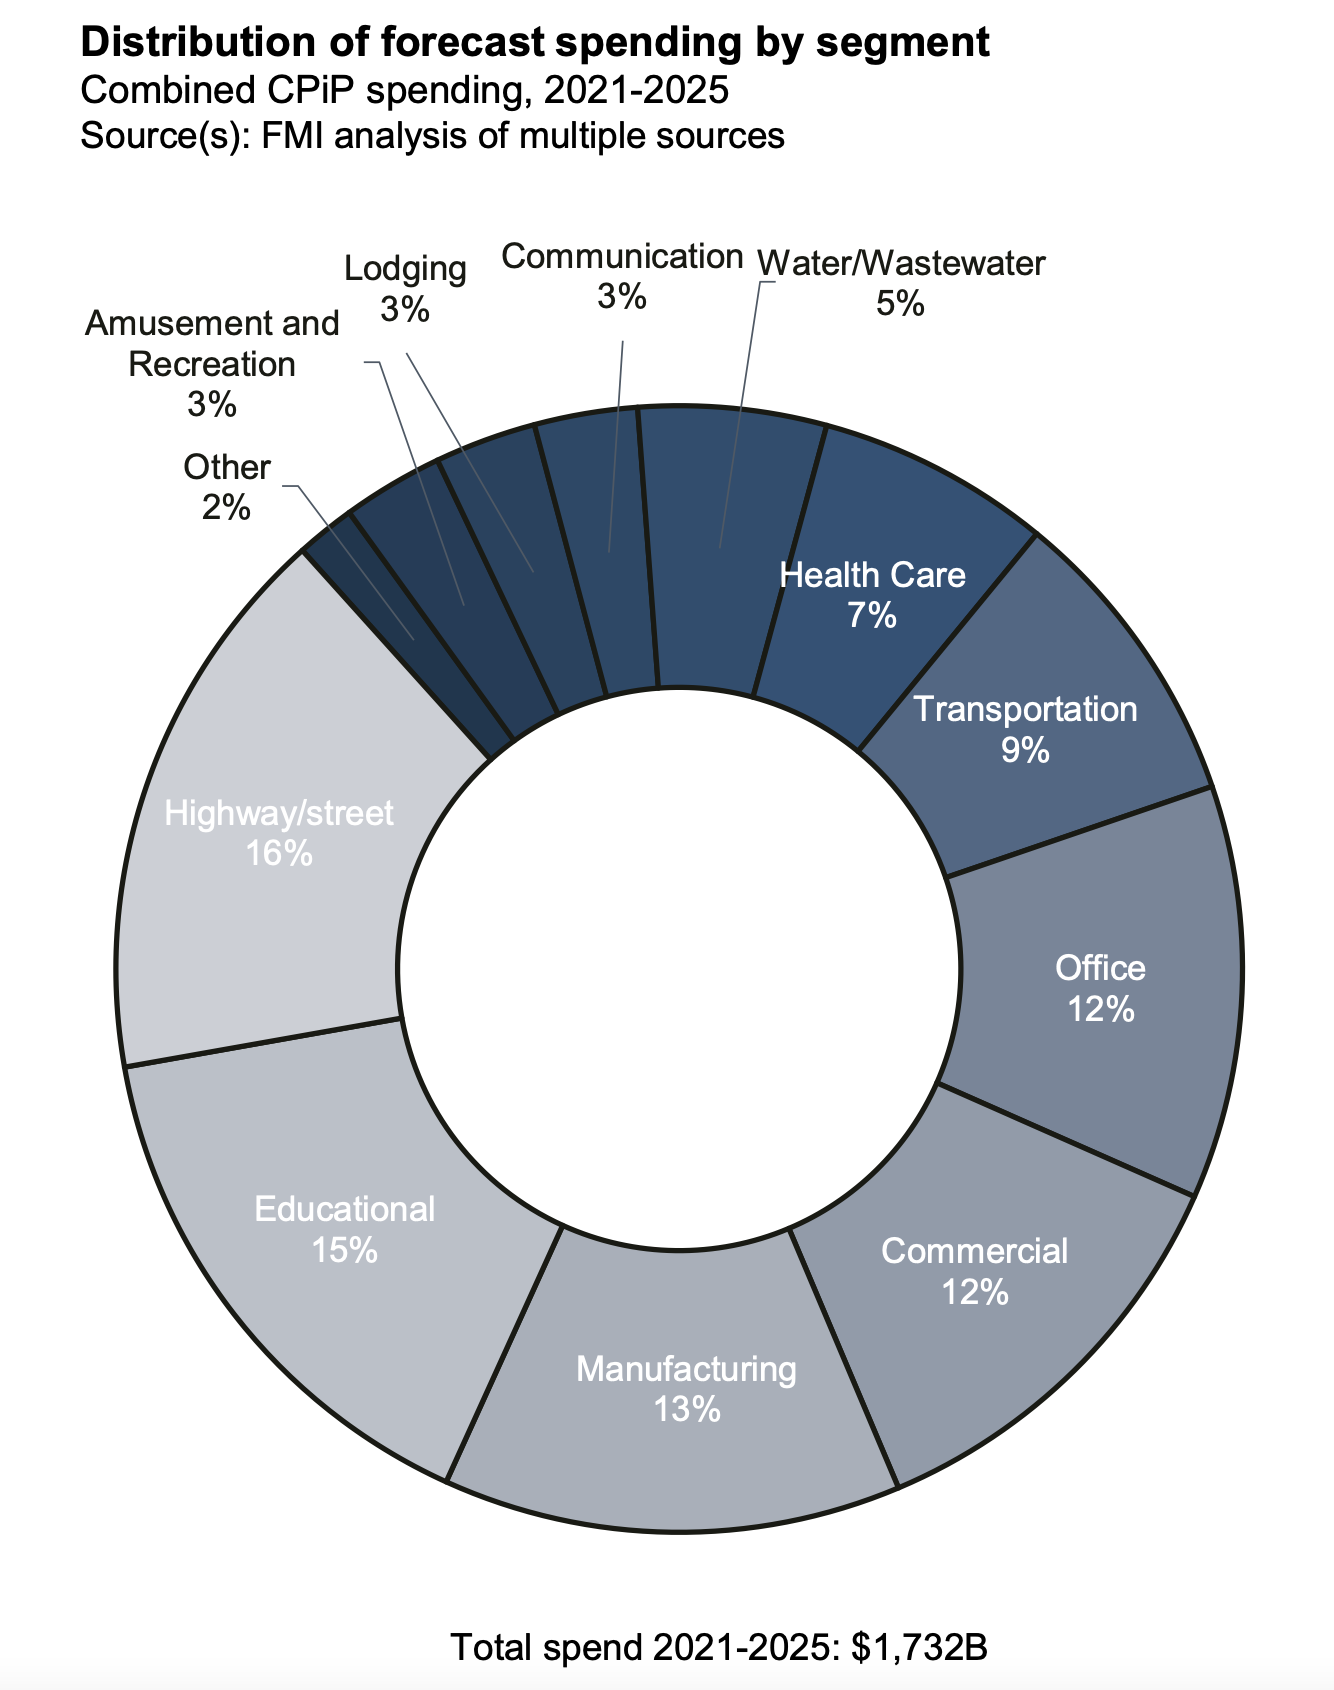
Over the forecast years, FMI estimates that the aggregate spending on projects delivered via design-build will be $1.732 trillion, or 46.2% of the $3.742 trillion spent on all construction projects. Highway and street projects will account for 16% of the design-build spending, followed by Education (15%), Manufacturing (13%) and Commercial and Office (12% each). Spending on design-build water/wastewater projects is expected to show the highest annual growth rate—11.1%—although that sector will represent only 5% of total design-build project spending over the forecast years.
Design-build rated highest across all project delivery methods, with 77% of the report’s respondents having “very good” or “excellent” experiences with the method. The 2021 study found that 60% of respondents identified “owner goals and objectives” as an influence on their choice of delivery methods, following by 50% who identified a project’s complexity and innovation, and 46% who cited “delivery schedule” or “contractor experience.”
HIGH FAVORABILITY QUOTIENT
Seventy-seven percent of the study’s respondents thought that the design-build delivery method would increase over the next five years. “We have seen significantly more design-build work,” stated one respondent quoted in the report. “Virtually everything in our geography is going design-build,” said another.
Conversely, respondents with less favorable experiences with design-build delivery noted that some owners still see this method as a way of transferring risk to the building team, and underestimate the commitment needed to make this delivery method work.
Most respondents, however, saw myriad benefits in design-build. For example, 76% of architects, designers, and engineers, and 89% of GCs and CMs, cited increased collaboration and creativity. Greater project and design control was cited by 88% of GCs/CMs and 84% of specialty trade contractors. GCs/CMs (who represented 31% of the study’s respondents) like the opportunities to innovate that design-build methods afford them, as do 90% of owner’s reps.
Nearly half—47%—of organizations that responded to FMI’s survey use fixed price/lump sum contracts for their design-build projects, compared to 39% that use guaranteed max price contracts.
Related Stories
Market Data | Jul 18, 2019
Construction contractors remain confident as summer begins
Contractors were slightly less upbeat regarding profit margins and staffing levels compared to April.
Market Data | Jul 17, 2019
Design services demand stalled in June
Project inquiry gains hit a 10-year low.
Market Data | Jul 16, 2019
ABC’s Construction Backlog Indicator increases modestly in May
The Construction Backlog Indicator expanded to 8.9 months in May 2019.
K-12 Schools | Jul 15, 2019
Summer assignments: 2019 K-12 school construction costs
Using RSMeans data from Gordian, here are the most recent costs per square foot for K-12 school buildings in 10 cities across the U.S.
Market Data | Jul 12, 2019
Construction input prices plummet in June
This is the first time in nearly three years that input prices have fallen on a year-over-year basis.
Market Data | Jul 1, 2019
Nonresidential construction spending slips modestly in May
Among the 16 nonresidential construction spending categories tracked by the Census Bureau, five experienced increases in monthly spending.
Market Data | Jul 1, 2019
Almost 60% of the U.S. construction project pipeline value is concentrated in 10 major states
With a total of 1,302 projects worth $524.6 billion, California has both the largest number and value of projects in the U.S. construction project pipeline.
Market Data | Jun 21, 2019
Architecture billings remain flat
AIA’s Architecture Billings Index (ABI) score for May showed a small increase in design services at 50.2.
Market Data | Jun 19, 2019
Number of U.S. architects continues to rise
New data from NCARB reveals that the number of architects continues to increase.
Market Data | Jun 12, 2019
Construction input prices see slight increase in May
Among the 11 subcategories, six saw prices fall last month, with the largest decreases in natural gas.


