

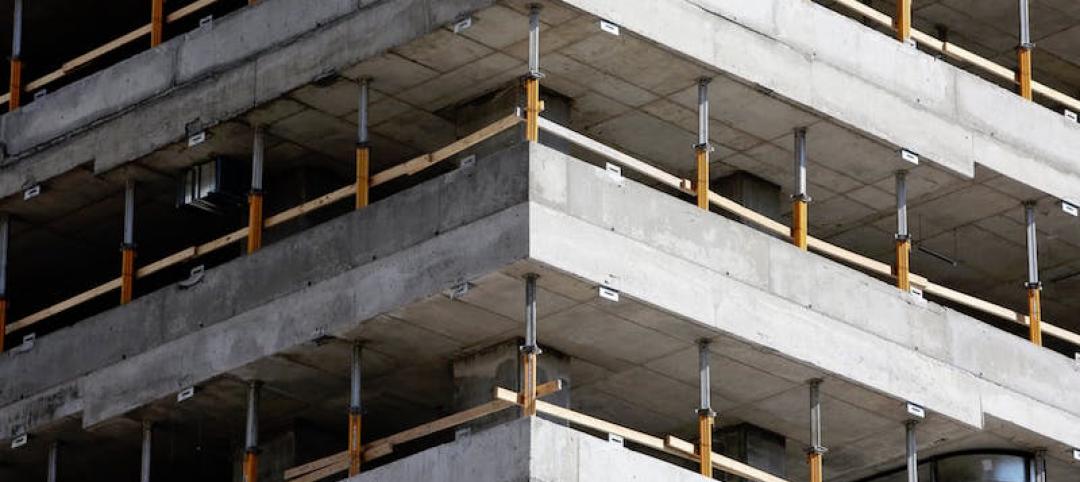
Design-build delivered projects will account for nearly half of all construction spending by 2025, according to the consulting and investment firm FMI’s latest market research on design-built utilization.
FMI’s research for its 50-page report is based on a survey of 279 industry stakeholders and 46 interviews. FMI conducted the study in partnership with the Design-Build Institute of America (DBIA), and piggybacks on research in 2018 that confirmed design-build was no longer just an alternative delivery method, but one that had been embraced by a growing number of owner-developers and their AEC partners.
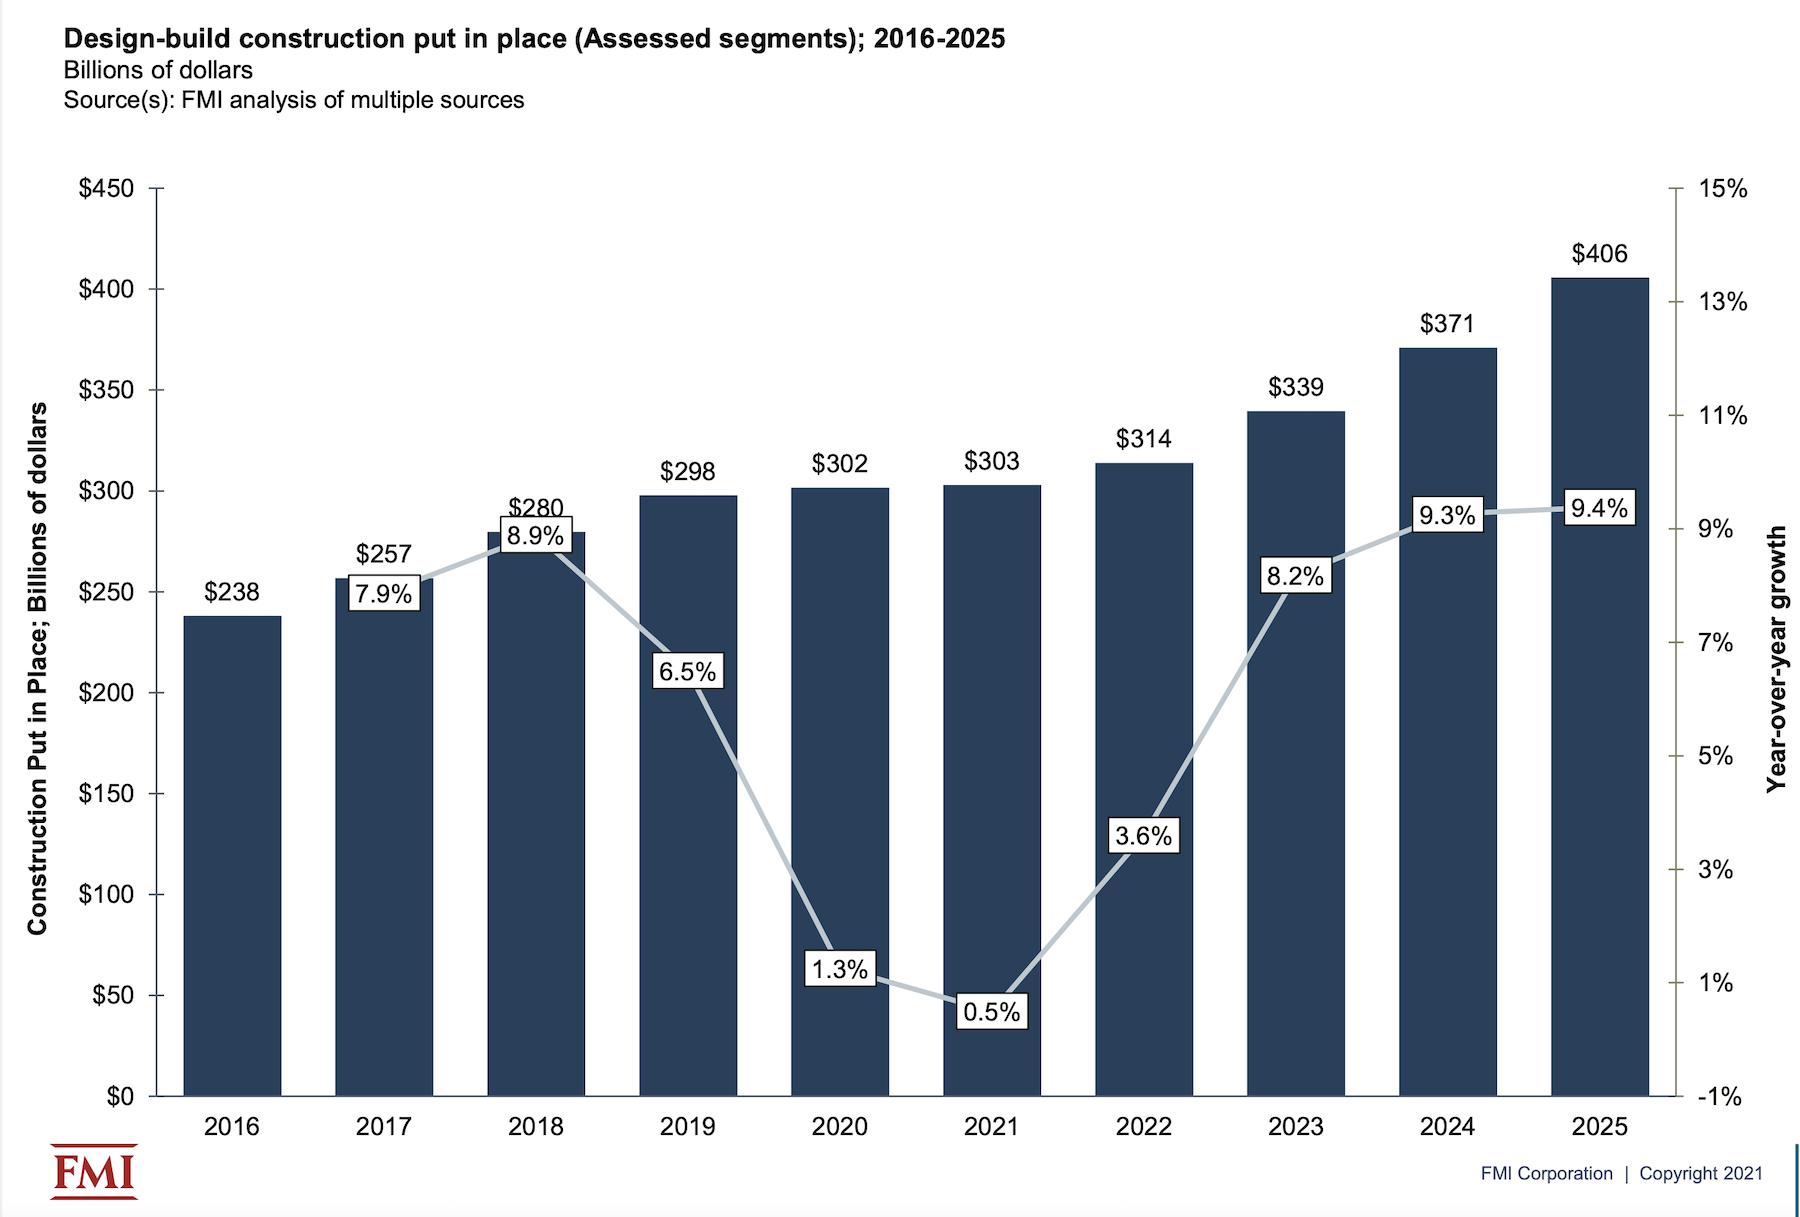
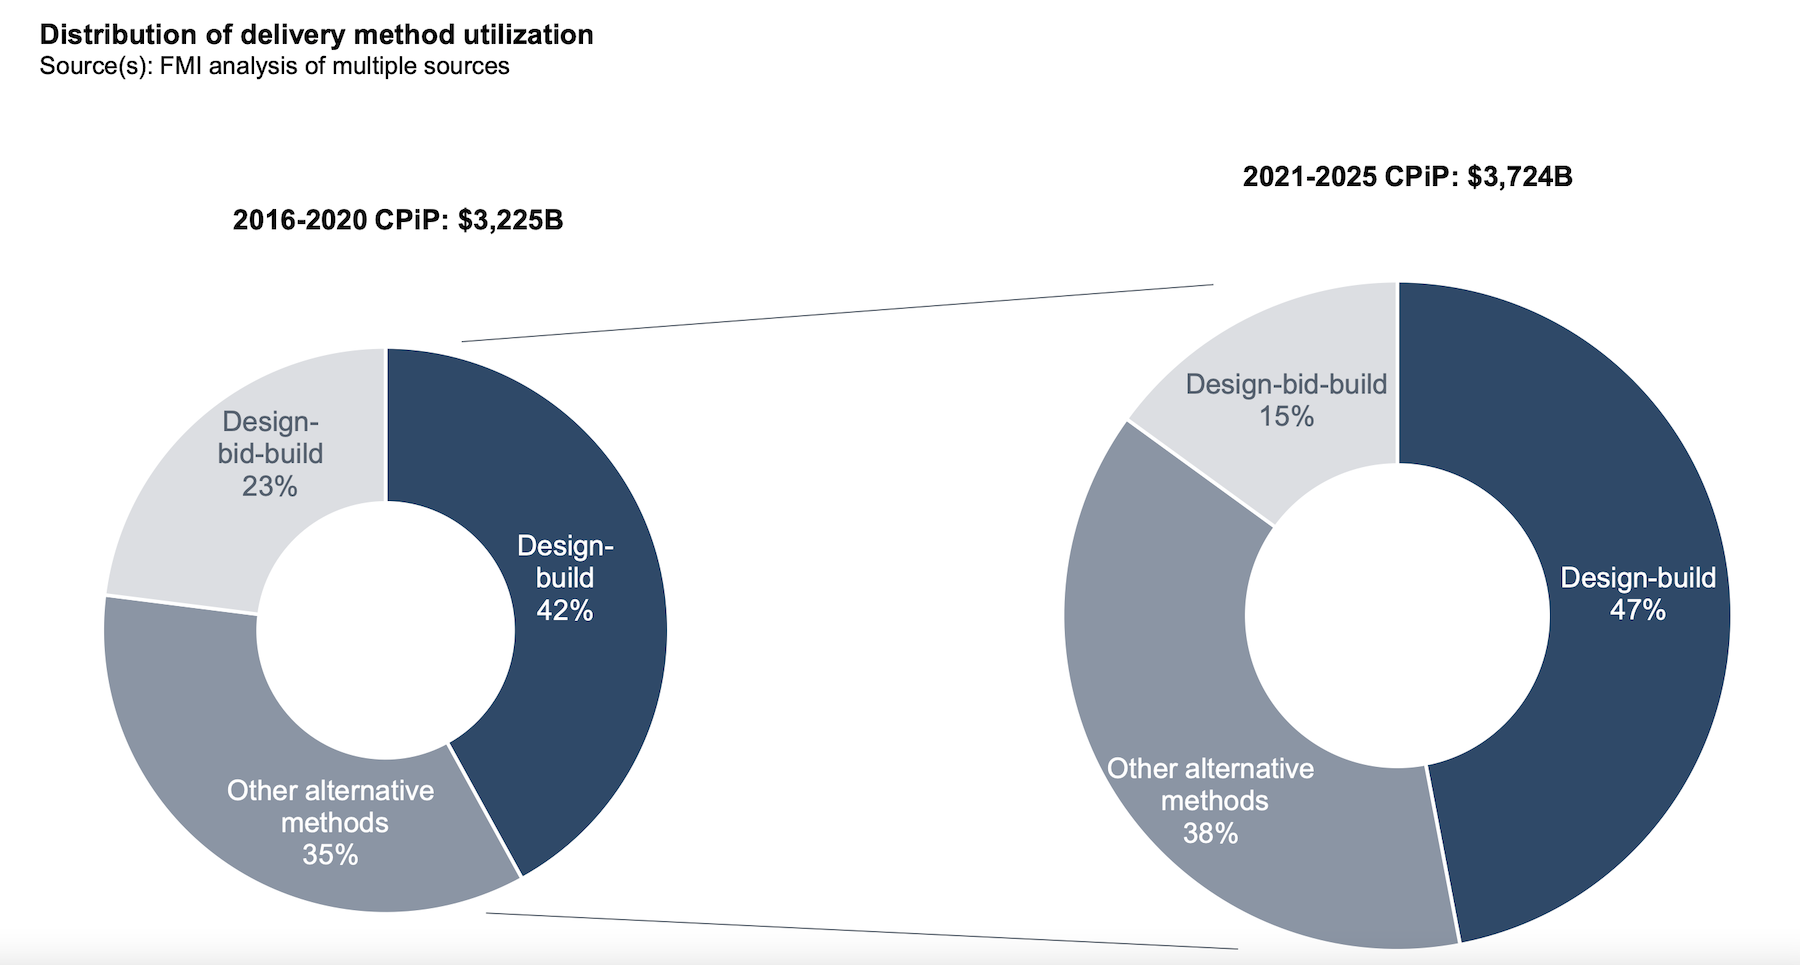
FMI’s latest report, which it releases today, forecasts that spending for design-build construction put in place will grow at a compound annual rate of 7.6% over the years 2021 through 2025, and hit $405.7 billion in 2025, or 47% of total construction spending that year, vs 42% of the total in 2021.
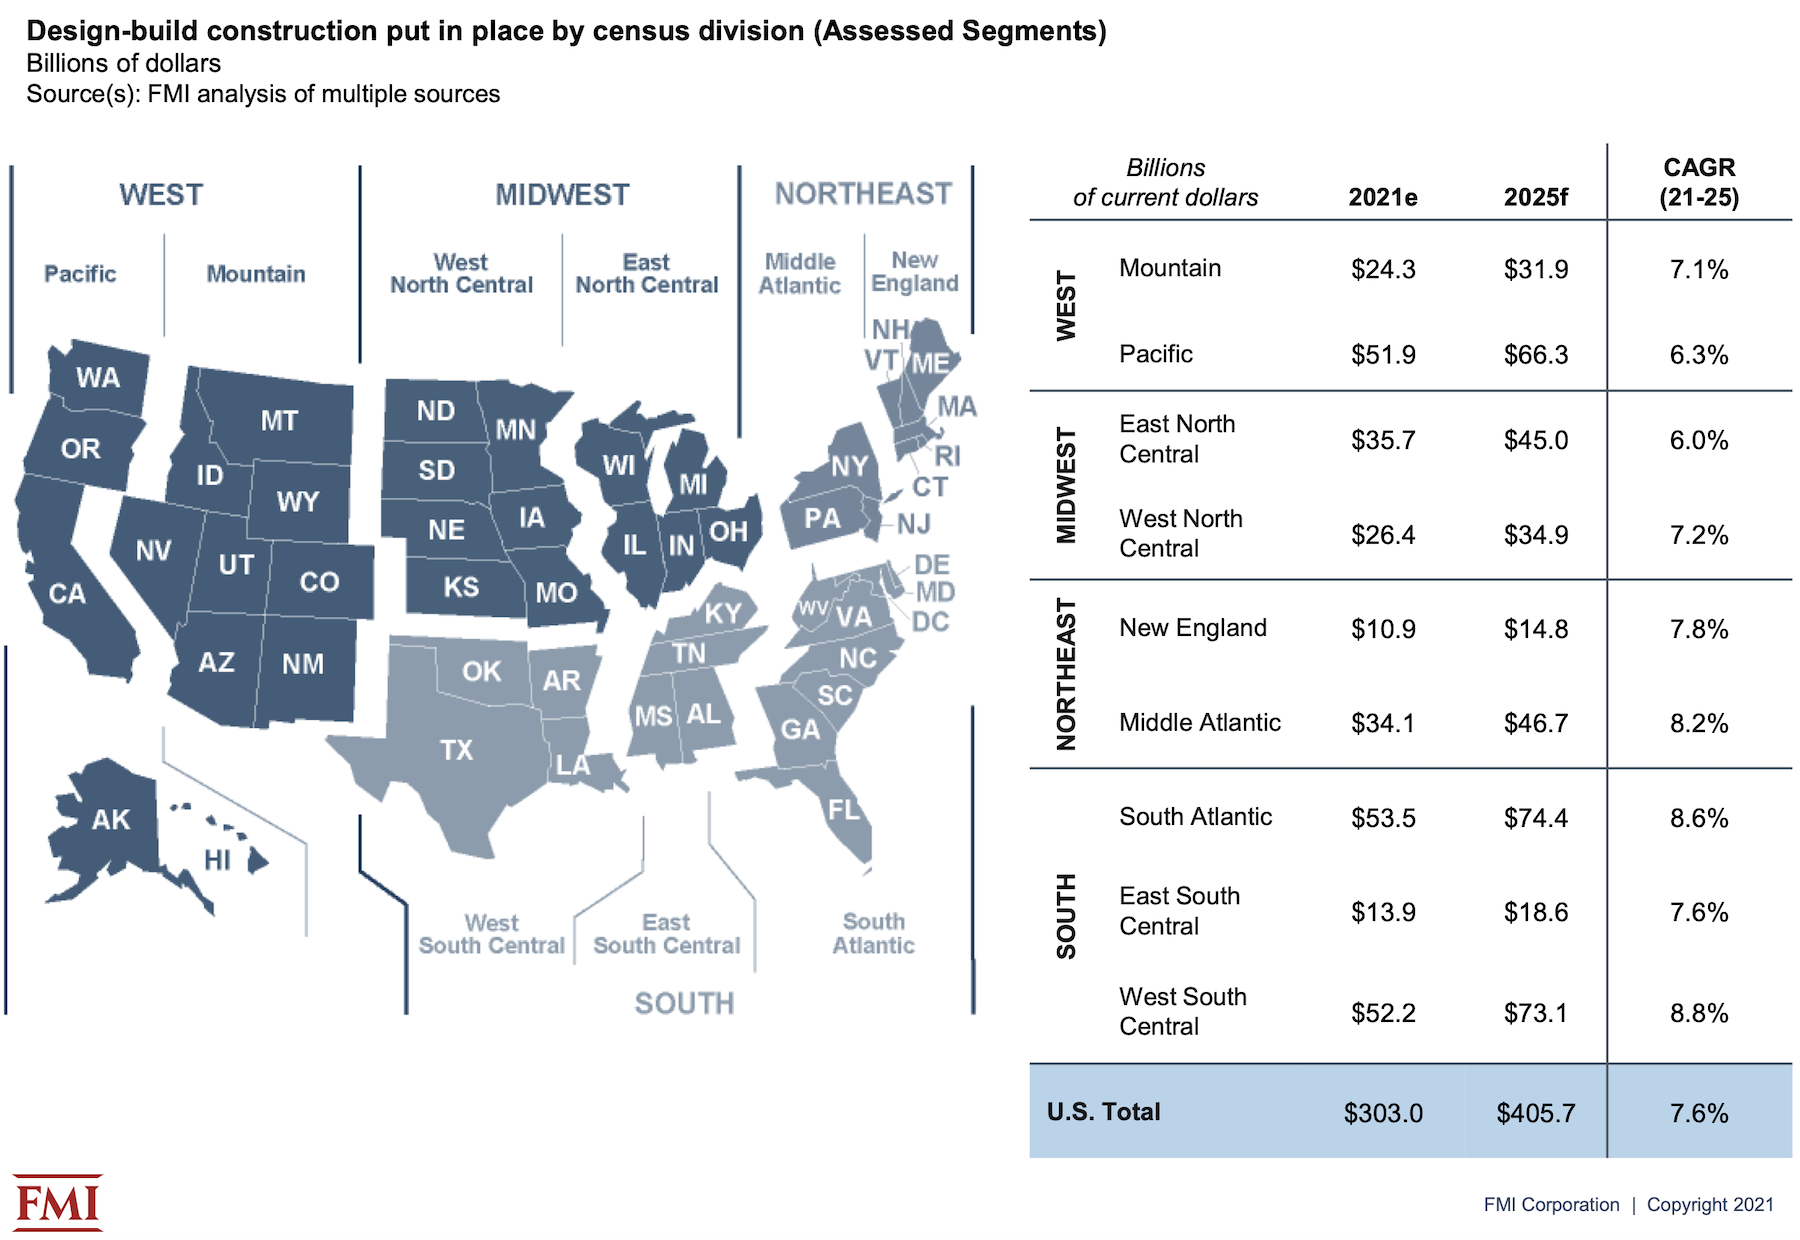
FMI expects the five-year rate of growth to be higher than the national average in the West South Central, South Atlantic, Middle Atlantic, and New England regions.
CERTAIN SECTORS MORE DISPOSED TOWARD DESIGN-BUILD
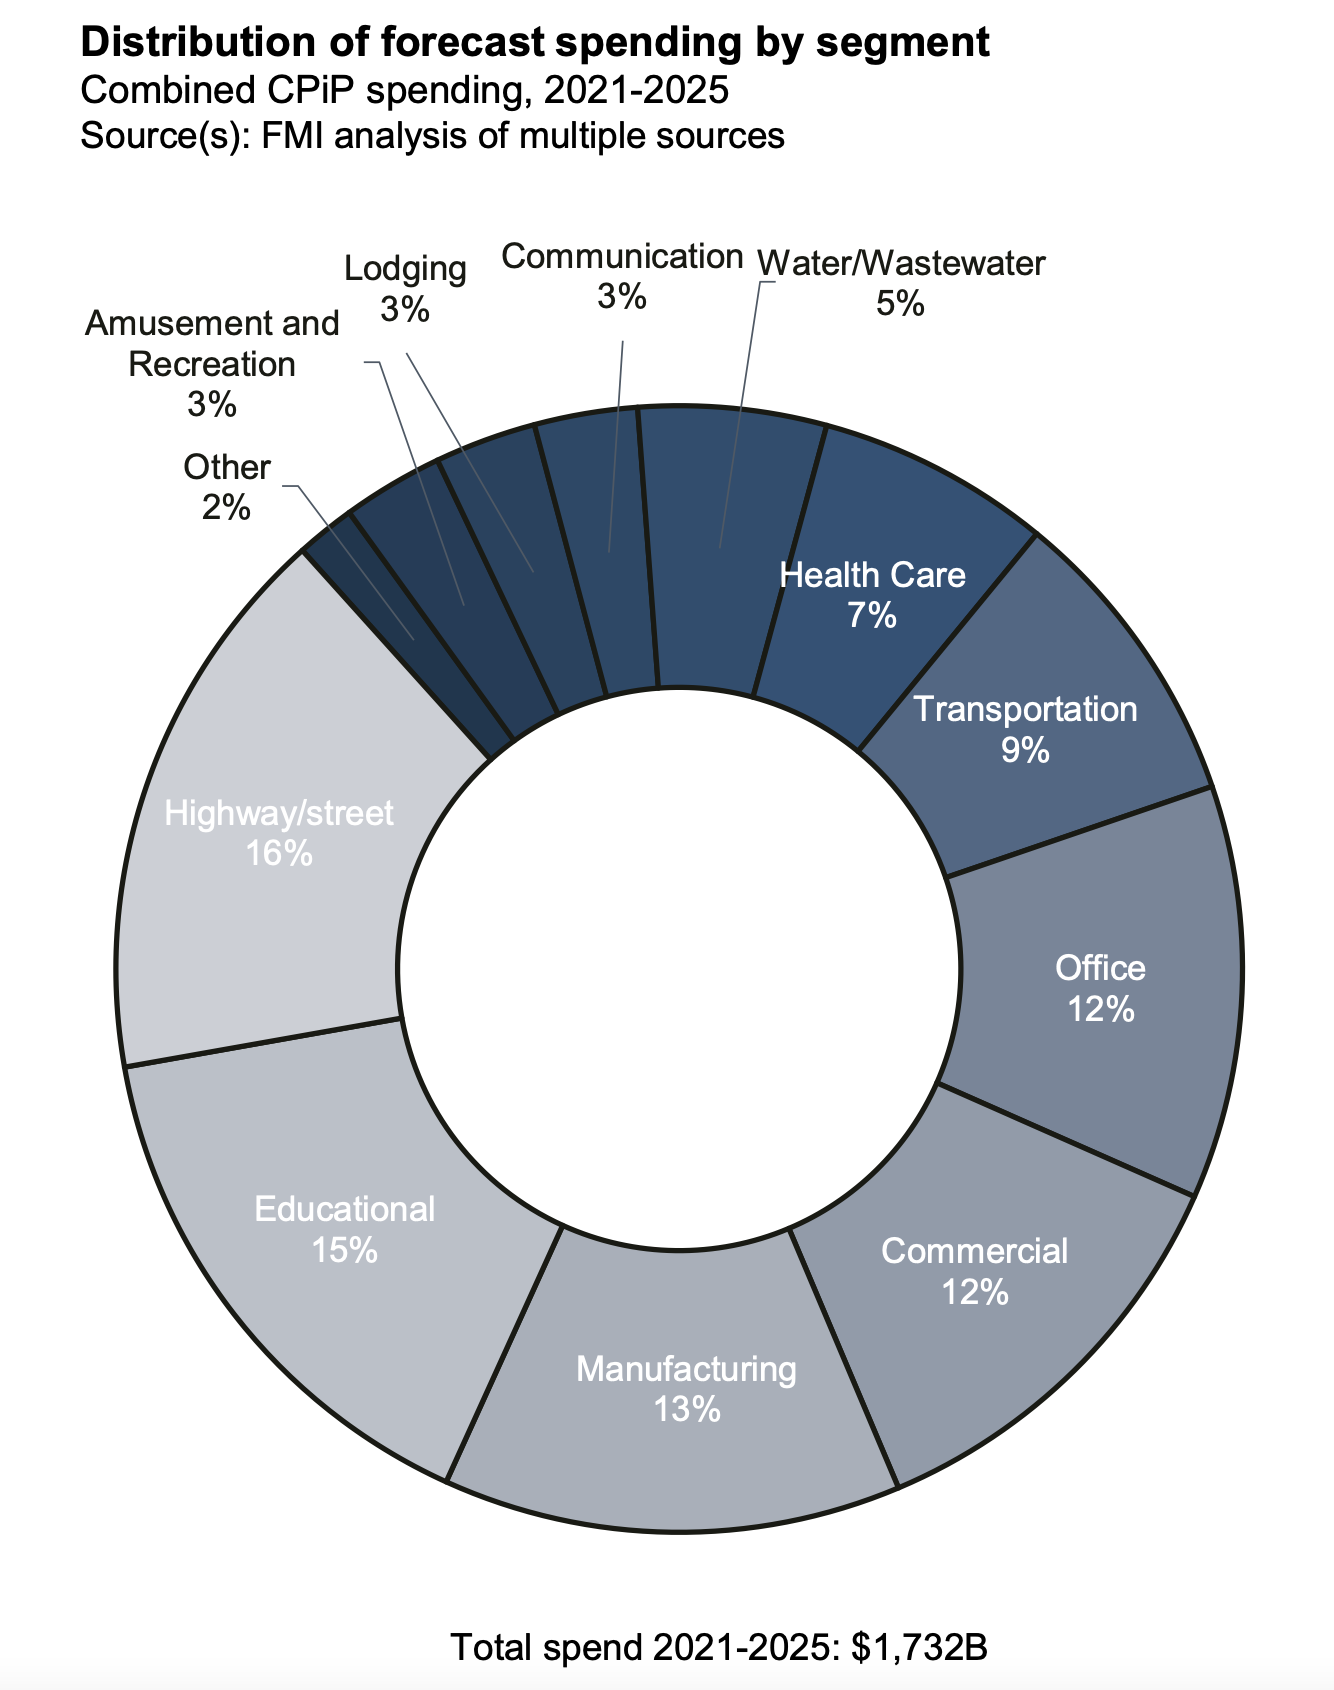
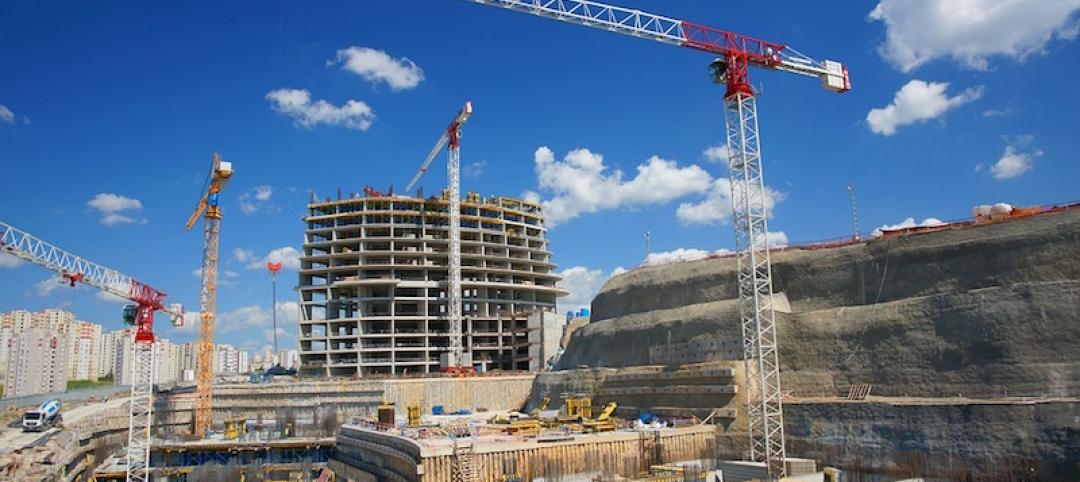
Over the forecast years, FMI estimates that the aggregate spending on projects delivered via design-build will be $1.732 trillion, or 46.2% of the $3.742 trillion spent on all construction projects. Highway and street projects will account for 16% of the design-build spending, followed by Education (15%), Manufacturing (13%) and Commercial and Office (12% each). Spending on design-build water/wastewater projects is expected to show the highest annual growth rate—11.1%—although that sector will represent only 5% of total design-build project spending over the forecast years.
Design-build rated highest across all project delivery methods, with 77% of the report’s respondents having “very good” or “excellent” experiences with the method. The 2021 study found that 60% of respondents identified “owner goals and objectives” as an influence on their choice of delivery methods, following by 50% who identified a project’s complexity and innovation, and 46% who cited “delivery schedule” or “contractor experience.”
HIGH FAVORABILITY QUOTIENT
Seventy-seven percent of the study’s respondents thought that the design-build delivery method would increase over the next five years. “We have seen significantly more design-build work,” stated one respondent quoted in the report. “Virtually everything in our geography is going design-build,” said another.
Conversely, respondents with less favorable experiences with design-build delivery noted that some owners still see this method as a way of transferring risk to the building team, and underestimate the commitment needed to make this delivery method work.
Most respondents, however, saw myriad benefits in design-build. For example, 76% of architects, designers, and engineers, and 89% of GCs and CMs, cited increased collaboration and creativity. Greater project and design control was cited by 88% of GCs/CMs and 84% of specialty trade contractors. GCs/CMs (who represented 31% of the study’s respondents) like the opportunities to innovate that design-build methods afford them, as do 90% of owner’s reps.
Nearly half—47%—of organizations that responded to FMI’s survey use fixed price/lump sum contracts for their design-build projects, compared to 39% that use guaranteed max price contracts.
Related Stories
Market Data | Nov 15, 2017
Architecture Billings bounce back
Business conditions remain uneven across regions.
Market Data | Nov 14, 2017
U.S. construction starts had three consecutive quarters of positive growth in 2017
ConstructConnect’s quarterly report shows the most significant annual growth in the civil engineering and residential sectors.

Market Data | Nov 3, 2017
New construction starts in 2018 to increase 3% to $765 billion: Dodge report
Dodge Outlook Report predicts deceleration but still growth, reflecting a mixed pattern by project type.
Market Data | Nov 2, 2017
Construction spending up in September; Down on a YOY basis
Nonresidential construction spending is down 2.9% on a year-over-year basis.
Market Data | Oct 19, 2017
Architecture Billings Index backslides slightly
Business conditions easing in the West.

Industry Research | Oct 3, 2017
Nonresidential construction spending stabilizes in August
Spending on nonresidential construction services is still down on a YOY basis.

Market Data | Sep 21, 2017
Architecture Billings Index continues growth streak
Design services remain in high demand across all regions and in all major sectors.

Market Data | Sep 21, 2017
How brand research delivers competitive advantage
Brand research is a process that firms can use to measure their reputation and visibility in the marketplace.

Contractors | Sep 19, 2017
Commercial Construction Index finds high optimism in U.S. commercial construction industry
Hurricane recovery efforts expected to heighten concerns about labor scarcities in the south, where two-thirds of contractors already face worker shortages.

Multifamily Housing | Sep 15, 2017
Hurricane Harvey damaged fewer apartments in greater Houston than estimated
As of Sept. 14, 166 properties reported damage to 8,956 units, about 1.4% of the total supply of apartments, according to ApartmentData.com.


