Top Federal Government Sector Architecture Firms
| Rank | Company | 2012 Federal Government Revenue ($) |
| 1 | HOK | $63,235,000 |
| 2 | SmithGroupJJR | $40,600,000 |
| 3 | PageSoutherlandPage | $39,650,000 |
| 4 | Heery International | $36,256,354 |
| 5 | IBI Group | $31,575,728 |
| 6 | EYP | $29,000,000 |
| 7 | Skidmore, Owings & Merrill | $24,731,000 |
| 8 | Stantec | $22,500,211 |
| 9 | Leo A Daly | $18,500,439 |
| 10 | Perkins+Will | $15,589,734 |
| 11 | Gensler | $15,050,000 |
| 12 | HDR Architecture | $14,939,610 |
| 13 | Cannon Design | $12,000,000 |
| 14 | RTKL Associates | $9,701,000 |
| 15 | Hammel, Green and Abrahamson | $9,223,000 |
| 16 | Flad Architects | $9,032,000 |
| 17 | HNTB Archtecture | $8,401,494 |
| 18 | EwingCole | $8,000,000 |
| 19 | Swanke Hayden Connell Asrchitects | $7,000,000 |
| 20 | Reynolds, Smith and Hills | $6,540,000 |
| 21 | ZGF Architects | $6,200,950 |
| 22 | Beyer Blinder Belle Architects & Planners | $6,088,547 |
| 23 | CTA Architects Engineers | $5,430,642 |
| 24 | Davis Brody Bond | $4,044,085 |
| 25 | Cooper Carry | $3,648,284 |
| 26 | Westlake Reed Leskosky | $3,000,000 |
| 27 | WDG Architecture | $2,625,000 |
| 28 | NBBJ | $2,306,000 |
| 29 | HKS | $2,000,000 |
| 29 | Solomon Cordwell Buenz | $2,000,000 |
| 31 | Environetics | $1,974,373 |
| 32 | Hoffmann Architects | $1,734,000 |
| 33 | Good Fulton & Farrell | $1,503,948 |
| 34 | Ware Malcomb | $1,330,000 |
| 35 | RNL | $1,170,000 |
| 36 | Lord, Aeck & Sargent | $1,120,000 |
| 37 | Hoefer Wysocki Architecture | $1,003,000 |
| 38 | Morris Architects | $1,000,000 |
| 39 | Moody Nolan | $780,000 |
| 40 | Ennead Architects | $517,000 |
| 41 | Gresham, Smith and Partners | $500,775 |
| 42 | PGAL | $375,000 |
| 43 | Epstein | $361,000 |
| 44 | BBG-BBGM | $350,000 |
| 45 | Smallwood, Reynolds, Stewart, Stewart & Associates | $323,554 |
| 46 | KZF Design | $292,615 |
| 47 | Baskervill | $222,000 |
| 48 | Emersion Design | $200,622 |
| 49 | Kaplan McLaughlin Diaz | $182,398 |
| 50 | Fentress Architects | $154,388 |
| 51 | WHR Architects | $23,636 |
| 52 | LS3P | $22,694 |
| 53 | SMMA | Symmes Maini & McKee Associates | $12,000 |
Top Federal Government Sector Engineering Firms
| Rank | Company | 2012 Federal Government Revenue ($) |
| 1 | Fluor | $1,238,675,000 |
| 2 | URS Corp. | $243,003,486 |
| 3 | AECOM Technology Corp. | $109,000,000 |
| 4 | Parsons Brinckerhoff | $42,703,522 |
| 5 | H&A Architects & Engineers | $37,417,066 |
| 6 | Merrick & Co. | $30,000,000 |
| 7 | Michael Baker Jr. | $14,460,000 |
| 8 | Affiliated Engineers | $9,058,000 |
| 9 | Bridgers & Paxton Consulting Engineers | $5,494,458 |
| 10 | Dewberry | $5,377,009 |
| 11 | SSOE Group | $4,332,078 |
| 12 | BRPH | $4,230,000 |
| 13 | GHT Limited | $4,200,000 |
| 14 | WSP USA | $4,150,000 |
| 15 | KPFF Consulting Engineers | $4,000,000 |
| 16 | Arup | $3,770,046 |
| 17 | RMF Engineering Design | $3,750,000 |
| 18 | Syska Hennessy Group | $3,200,000 |
| 19 | Guernsey | $2,835,981 |
| 20 | Burns & McDonnell | $2,500,000 |
| 21 | STV | $2,286,000 |
| 22 | Wiss, Janney, Elstner Associates | $2,253,000 |
| 23 | GRW | $2,051,368 |
| 24 | Vanderweil Engineers | $2,029,000 |
| 25 | Coffman Engineers | $2,022,000 |
| 26 | CCRD Partners | $2,000,000 |
| 26 | Rolf Jensen & Associates | $2,000,000 |
| 28 | Haynes Whaley Associates | $1,878,235 |
| 29 | Degenkolb Engineers | $1,752,925 |
| 30 | Clark Nexsen | $1,610,728 |
| 31 | Simpson Gumpertz & Heger | $1,600,000 |
| 32 | Newcomb & Boyd | $1,551,855 |
| 33 | Barge, Waggoner, Sumner and Cannon | $1,500,000 |
| 34 | TTG | $1,375,250 |
| 35 | H.F. Lenz | $1,300,000 |
| 36 | Interface Engineering | $1,232,906 |
| 37 | Glumac | $1,172,000 |
| 38 | Eaton Energy Solutions | $1,151,312 |
| 39 | M/E Engineering | $1,134,350 |
| 40 | Spectrum Engineers | $1,024,300 |
| 41 | Walker Parking Consultants | $900,000 |
| 42 | KJWW Engineering Consultants | $874,692 |
| 43 | RDK Engineers | $852,000 |
| 44 | Middough | $800,000 |
| 45 | AKF Group | $753,880 |
| 46 | Science Applications International Corp. | $680,606 |
| 47 | Buro Happold Consulting Engineers | $620,000 |
| 48 | Bergmann Associates | $607,000 |
| 49 | Henderson Engineers | $512,903 |
| 50 | Shive-Hattery | $467,969 |
| 51 | Allen & Shariff | $390,000 |
| 52 | KCI Technologies | $300,000 |
| 53 | Ross & Baruzzini | $218,317 |
| 54 | CTLGroup | $200,000 |
| 55 | Environmental Systems Design | $183,085 |
| 56 | Brinjac Engineering | $167,171 |
| 57 | Dunham Associates | $160,000 |
| 58 | TLC Engineering for Architecture | $151,241 |
| 59 | Aon Fire Protection Engineering | $100,000 |
| 59 | Rist-Frost-Shumway Engineering | $100,000 |
| 61 | Sparling | $88,347 |
| 62 | Thornton Tomasetti | $76,498 |
| 63 | Davis, Bowen & Friedel | $40,000 |
| 64 | Apogee Consulting Group | $25,000 |
| 65 | G&W Engineering | $20,000 |
Top Federal Government Sector Construction Firms
| Rank | Company | 2012 Federal Government Revenue ($) |
| 1 | Clark Group | $399,007,396 |
| 2 | PCL Construction Enterprises | $298,606,437 |
| 3 | Hensel Phelps | $285,134,984 |
| 4 | Whiting-Turner Contracting Co., The | $233,168,558 |
| 5 | Gilbane | $188,656,000 |
| 6 | Walsh Group, The | $174,977,580 |
| 7 | Balfour Beatty | $163,198,909 |
| 8 | Turner Corporation, The | $162,590,000 |
| 9 | Mortenson Construction | $134,476,000 |
| 10 | James G Davis Construction | $130,000,000 |
| 11 | Swinerton Builders | $114,383,850 |
| 12 | Yates Cos., The | $108,400,000 |
| 13 | Ryan Companies US | $92,907,430 |
| 14 | Tutor Perini Corporation | $76,512,409 |
| 15 | Skanska USA | $72,407,000 |
| 16 | HITT Contracting | $69,301,488 |
| 17 | JE Dunn Construction | $66,537,322 |
| 18 | Pepper Construction Group | $66,252,000 |
| 19 | E.W. Howell | $65,058,000 |
| 20 | McCarthy Holdings | $38,000,000 |
| 21 | ECC | $30,932,981 |
| 22 | Structure Tone | $30,000,000 |
| 23 | Hoar Construction | $27,044,000 |
| 24 | Sundt Construction | $25,114,575 |
| 25 | Jones Lang LaSalle | $20,643,650 |
| 26 | Messer Construction | $18,067,633 |
| 27 | Consigli Construction | $14,682,377 |
| 28 | Lend Lease | $12,060,000 |
| 29 | Flintco | $10,250,000 |
| 30 | Hoffman Construction | $7,850,405 |
| 31 | LPCiminelli | $6,567,678 |
| 32 | Brasfield & Gorrie | $5,839,339 |
| 33 | Hunt Companies | $4,337,207 |
| 34 | Weitz Co., The | $2,000,000 |
| 35 | Graycor | $1,334,681 |
| 36 | Coakley & Williams Construction | $1,026,306 |
| 37 | Bomel Construction | $1,000,000 |
| 38 | New South Construction | $400,000 |
| 39 | KBE Building Corporation | $378,694 |
| 40 | DPR Construction | $237,867 |
| 41 | CORE Construction Group | $96,068 |
| 41 | Kitchell | $80,000 |
Back to Government Giants article
Read the full 2013 Giants 300 Report
Related Stories
| Dec 15, 2014
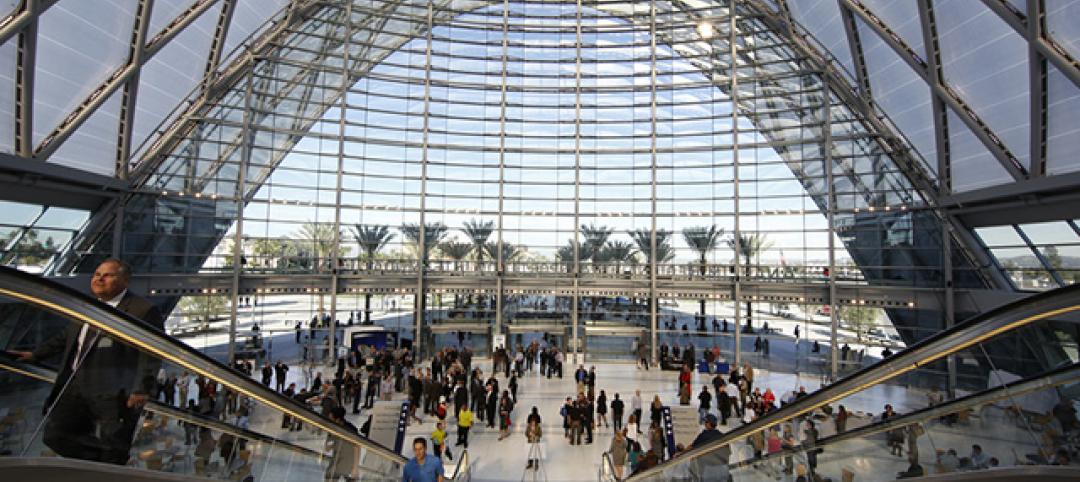
HOK-designed Anaheim Regional transit hub opens, expected to serve three million per year
ARTIC’s flexible design ensures that it can serve as a southern terminus for California’s future high-speed rail system.
| Dec 8, 2014
Moshe Safdie wants to reinvent airports with Jewel Changi Airport addition
A new addition to Singapore's Changi Airport, designed by Moshe Safdie, will feature a waterfall and extensive indoor gardens.
| Nov 19, 2014
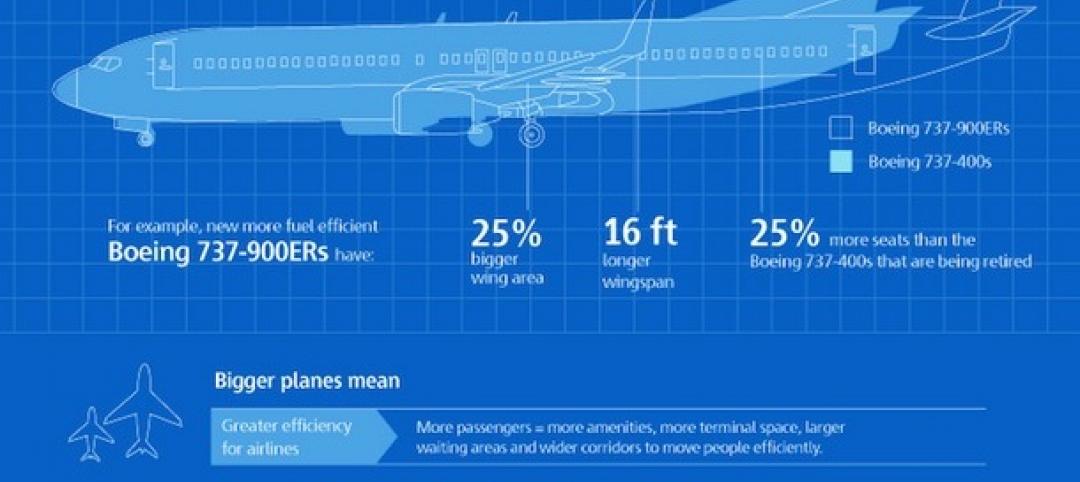
The evolution of airport design and construction [infographic]
Safety, consumer demand, and the new economics of flight are three of the major factors shaping how airlines and airport officials are approaching the need for upgrades and renovations, writes Skanska USA's MacAdam Glinn.
| Nov 18, 2014
Grimshaw releases newest designs for world’s largest airport
The airport is expected to serve 90 million passengers a year on the opening of the first phase, and more than 150 million annually after project completion in 2018.
| Nov 14, 2014
JetBlue opens Gensler-designed International Concourse at JFK
The 175,000-sf extension includes the conversion of three existing gates to international swing gates, and the addition of three new international swing gates.
Sponsored | | Nov 12, 2014
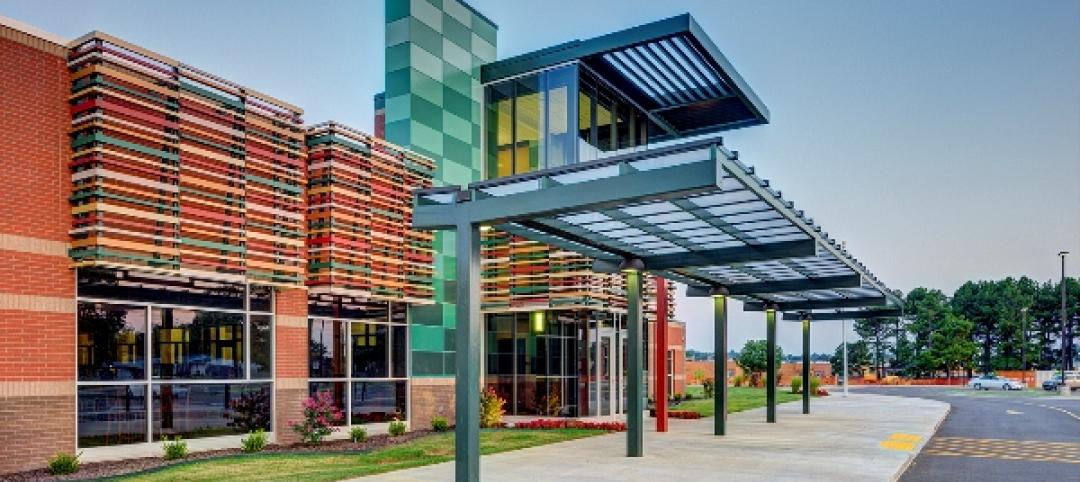
Eye-popping façade highlights renovation, addition at Chaffin Junior High School
The new distinctive main entrance accentuates the public face of the school with an aluminum tube “baguette” system.
| Oct 26, 2014
New York initiates design competition for upgrading LaGuardia, Kennedy airports
New York Gov. Andrew Cuomo said that the state would open design competitions to fix and upgrade New York City’s aging airports. But financing construction is still unsettled.
| Oct 16, 2014
Perkins+Will white paper examines alternatives to flame retardant building materials
The white paper includes a list of 193 flame retardants, including 29 discovered in building and household products, 50 found in the indoor environment, and 33 in human blood, milk, and tissues.
| Oct 12, 2014
AIA 2030 commitment: Five years on, are we any closer to net-zero?
This year marks the fifth anniversary of the American Institute of Architects’ effort to have architecture firms voluntarily pledge net-zero energy design for all their buildings by 2030.
| Sep 24, 2014
Architecture billings see continued strength, led by institutional sector
On the heels of recording its strongest pace of growth since 2007, there continues to be an increasing level of demand for design services signaled in the latest Architecture Billings Index.


