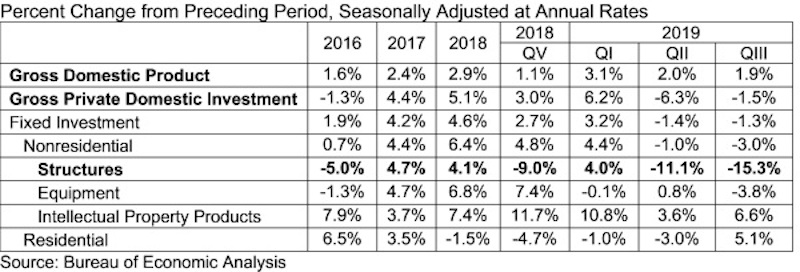
The U.S. economy expanded at an annualized rate of 1.9% in the third quarter of 2019 despite contracting levels of nonresidential investment, according to an Associated Builders and Contractors analysis of data released today by the U.S. Bureau of Economic Analysis. Nonresidential fixed investment declined at a 3% annual rate in the third quarter after declining at a 1% rate in the second quarter.
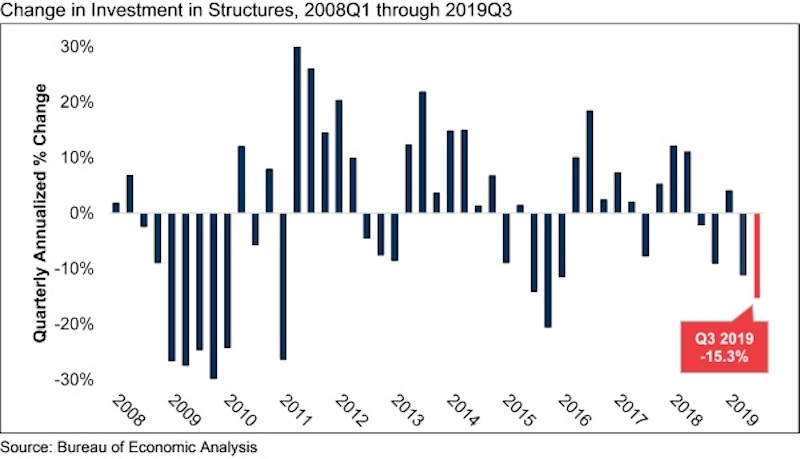
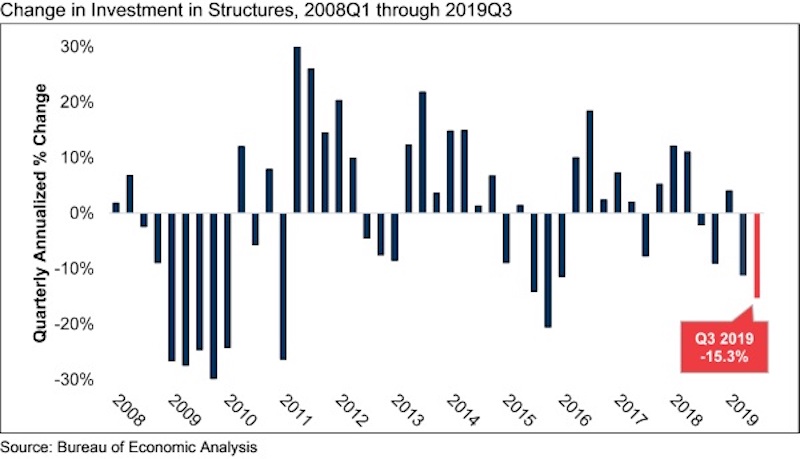
The annual rate for nonresidential fixed investment in structures, a component closely tied to construction, declined 15.3% in the third quarter. Investment in structures has now contracted in four of the previous five quarters, including an 11.1% decline in the second quarter of 2019.
“Today’s report reinforced a number of observations regarding the U.S. economy and the nation’s nonresidential construction sector,” said ABC Chief Economist Anirban Basu. “First, the economy is slowing. While consumer spending and government outlays remain elevated, gross private domestic investment continues to slip, this time by 1.5% on an annualized basis in the third quarter. While this is less than the 6.3% decline registered during the second quarter, the key takeaway is that the current economic expansion is narrowing, increasingly fueled by consumers and public agencies taking on additional debt.
“Second, certain segments of nonresidential construction continue to soften,” said Basu. “Recent data regarding nonresidential construction spending indicate weaker spending in categories such as office and lodging. This was reflected in today’s GDP report, which indicated that spending on structures contracted significantly during the third quarter. For the most part, nonresidential construction spending growth continues to be driven by public construction, including in categories such as water supply and public safety.
“The primary question now is whether the slowdown in economic activity will persist into 2020,” said Basu. “Many factors suggest it will, including a weakening global economy, a U.S. manufacturing sector that is arguably already in recession, vulnerability attributable to massive accumulations of public, corporate and household debt and the uncertain outcomes attached to ongoing trade negotiations. On the other hand, U.S. equity markets have continued to surge higher in the context of better-than-expected corporate earnings and ongoing accommodation by the Federal Reserve. Put it all together and the outlook for the U.S. economy has seldom been more uncertain, especially given next year’s elections.
Related Stories
Market Data | Jul 18, 2019
Construction contractors remain confident as summer begins
Contractors were slightly less upbeat regarding profit margins and staffing levels compared to April.
Market Data | Jul 17, 2019
Design services demand stalled in June
Project inquiry gains hit a 10-year low.
Market Data | Jul 16, 2019
ABC’s Construction Backlog Indicator increases modestly in May
The Construction Backlog Indicator expanded to 8.9 months in May 2019.
K-12 Schools | Jul 15, 2019
Summer assignments: 2019 K-12 school construction costs
Using RSMeans data from Gordian, here are the most recent costs per square foot for K-12 school buildings in 10 cities across the U.S.
Market Data | Jul 12, 2019
Construction input prices plummet in June
This is the first time in nearly three years that input prices have fallen on a year-over-year basis.
Market Data | Jul 1, 2019
Nonresidential construction spending slips modestly in May
Among the 16 nonresidential construction spending categories tracked by the Census Bureau, five experienced increases in monthly spending.
Market Data | Jul 1, 2019
Almost 60% of the U.S. construction project pipeline value is concentrated in 10 major states
With a total of 1,302 projects worth $524.6 billion, California has both the largest number and value of projects in the U.S. construction project pipeline.
Market Data | Jun 21, 2019
Architecture billings remain flat
AIA’s Architecture Billings Index (ABI) score for May showed a small increase in design services at 50.2.
Market Data | Jun 19, 2019
Number of U.S. architects continues to rise
New data from NCARB reveals that the number of architects continues to increase.
Market Data | Jun 12, 2019
Construction input prices see slight increase in May
Among the 11 subcategories, six saw prices fall last month, with the largest decreases in natural gas.


