

 Regional Transportation Intermodal Center is a project of the cit")
Federal, state, and local government construction hasn’t exactly been a steamroller for the past few years, due to the end of stimulus availability and the ongoing effects of budget sequestration.
At press time, the most recent Commerce Department report indicated that government construction spending was up just under 1% in April, to a seasonally adjusted annual rate of $267 billion, despite overall economic contraction of about 1% in the first quarter. Federal construction spending was the growth leader, rising by 1.9% to a rate of $23.5 billion. State and local projects—a much larger piece of the public pie—were up just 0.7%, to $243.5 billion.
Among non-infrastructure public construction spending categories, healthcare (up 6%) and education (up 2%) appear most promising for this year, according to the Associated Builders and Contractors’ 2014 forecast.
Improving energy performance of existing properties through targeted upgrades—and, sometimes, large-scale reconstruction—continues to be a federal priority. Of 20 projects recently honored by the General Services Administration’s Design Awards program, half were reconstruction jobs, ranging from Beaux Arts courthouses to Modernist offices.
Along with the push for energy efficiency, federal agencies are increasingly exploring telework as an alternative to expanding office space. The bright side? Telecom and AV renovations will be required to help agencies keep off-site staff connected.
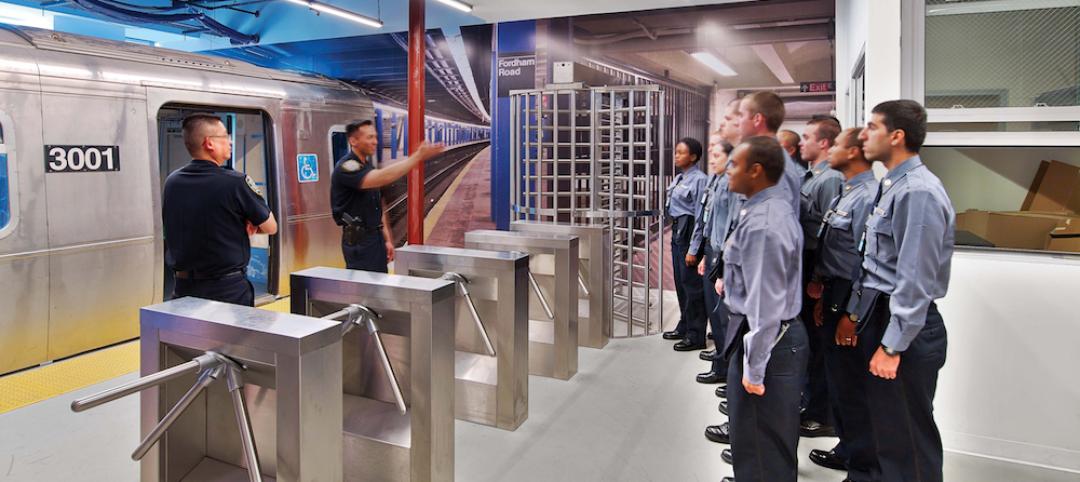
Many state and local governments continue to struggle with the sluggish overall economy, causing delays in needed construction. Among the discernible themes among state and local projects submitted to BD+C: new police facilities (designed to reflect changing ideas about community policing), replacement and upgraded courthouses, and mass-transit stations.
Top Government Sector Architecture Firms
| Rank | Company | 2013 Government Revenue |
| 1 | Stantec | $144,299,056 |
| 2 | Heery International | 125,058,364 |
| 3 | HOK | 114,753,666 |
| 4 | SmithGroupJJR | 83,064,158 |
| 5 | HDR | 81,601,164 |
| 6 | Skidmore, Owings & Merrill | 57,835,664 |
| 7 | SHW Group | 56,007,000 |
| 8 | Gensler | 52,272,600 |
| 9 | EYP Architecture & Engineering | 42,800,000 |
| 10 | RS&H | 39,200,000 |
| 11 | Page | 38,704,000 |
| 12 | Moseley Architects | 35,135,469 |
| 13 | Leo A Daly | 29,483,542 |
| 14 | Perkins+will | 28,975,375 |
| 15 | Clark Nexsen | 28,873,388 |
| 16 | ZGF Architects | 27,425,548 |
| 17 | CannonDesign | 27,000,000 |
| 18 | FreemanWhite | 25,941,154 |
| 19 | NBBJ | 19,382,000 |
| 20 | DLR Group | 19,300,000 |
| 21 | Hammel, Green and Abrahamson | 19,167,839 |
| 22 | EwingCole | 17,300,000 |
| 23 | HKS | 17,247,862 |
| 24 | PGAL | 16,097,917 |
| 25 | HNTB Corp. | 15,269,498 |
| 26 | Westlake Reed Leskosky | 15,049,000 |
| 27 | Quattrocchi Kwok Architects | 13,230,000 |
| 28 | Hoefer Wysocki Architecture | 12,860,000 |
| 29 | Fentress Architects | 12,160,971 |
| 30 | BLDD Architects | 11,800,000 |
| 31 | RTKL Associates | 11,469,000 |
| 32 | SchenkelShultz Architecture | 11,278,000 |
| 33 | NORR | 9,792,248 |
| 34 | LS3P | 8,882,375 |
| 35 | Morris Architects | 8,350,000 |
| 36 | Davis Brody Bond | 8,263,108 |
| 37 | LaBella Associates | 8,130,000 |
| 38 | CTA Architects Engineers | 8,014,884 |
| 39 | Beyer Blinder Belle | 7,947,688 |
| 40 | HMC Architects | 6,811,005 |
| 41 | VOA Associates | 6,808,200 |
| 42 | Parkhill, Smith & Cooper | 6,687,000 |
| 43 | Rosser International | 6,652,324 |
| 44 | LMN Architects | 6,388,100 |
| 45 | Sherlock, Smith & Adams | 6,388,000 |
| 46 | Becker Morgan Group | 6,343,277 |
| 47 | Flad Architects | 6,126,870 |
| 48 | KZF Design | 5,887,462 |
| 49 | Epstein | 5,402,000 |
| 50 | IBI Group ? Gruzen Samton | 5,000,000 |
| 51 | Solomon Cordwell Buenz | 4,500,000 |
| 52 | Goodwyn Mills & Cawood | 4,409,249 |
| 53 | Wight & Company | 4,402,093 |
| 54 | RSP Architects | 4,326,000 |
| 55 | Harley Ellis Devereaux | 4,310,000 |
| 56 | Carrier Johnson + Culture | 4,066,891 |
| 57 | BRPH | 3,957,000 |
| 58 | FGM Architects | 3,776,698 |
| 59 | Ennead Architects | 3,729,000 |
| 60 | RNL | 3,418,000 |
| 61 | WDG Architecture | 3,095,000 |
| 62 | Perkins Eastman | 3,000,000 |
| 63 | GWWO | 2,965,804 |
| 64 | Gresham, Smith and Partners | 2,787,930 |
| 65 | Integrus Architecture | 2,705,119 |
| 66 | Hoffmann Architects | 2,654,000 |
| 67 | Swanke Hayden Connell Architects | 2,534,000 |
| 68 | Ratio Architects | 2,462,355 |
| 69 | LPA | 2,205,538 |
| 70 | Emersion Design | 2,183,039 |
| 71 | Array Architects | 2,138,000 |
| 72 | WHR Architects | 2,076,445 |
| 73 | Cooper Carry | 1,987,669 |
| 74 | Little | 1,961,000 |
| 75 | Bergmann Associates | 1,941,360 |
| 76 | OZ Architecture | 1,724,680 |
| 77 | Legat Architects | 1,675,500 |
| 78 | LBL Architects | 1,600,000 |
| 79 | Schrader Group Architecture | 1,573,559 |
| 80 | Symmes Maini & McKee Associates | 1,563,000 |
| 81 | Good Fulton & Farrell | 1,373,500 |
| 82 | H+L Architecture | 1,295,496 |
| 83 | Harvard Jolly Architecture | 1,221,576 |
| 84 | Cambridge Seven Associates | 1,210,000 |
| 85 | FXFOWLE Architects | 1,180,000 |
| 86 | Smallwood, Reynolds, Stewart, Stewart & Associates | 1,128,560 |
| 87 | Moody Nolan | 1,083,924 |
| 88 | CO Architects | 1,031,600 |
| 89 | Shepley Bulfinch | 836,000 |
| 90 | Corgan | 762,894 |
| 91 | Cuningham Group Architecture | 742,891 |
| 92 | Lord Aeck Sargent | 742,273 |
| 93 | GBBN Architects | 660,000 |
| 94 | Nadel | 650,000 |
| 95 | Eppstein Uhen Architects | 640,751 |
| 96 | Commonwealth Architects | 599,591 |
| 97 | Hastings+Chivetta Architects | 491,188 |
| 98 | DesignGroup | 433,190 |
| 99 | Baskervill | 391,276 |
| 100 | Payette | 383,755 |
| 101 | Taylor Design | 372,052 |
| 102 | LawKingdon Architecture | 350,000 |
| 103 | Anderson Mikos Architects | 350,000 |
| 104 | NAC|Architecture | 345,476 |
| 105 | Environetics | 341,475 |
| 106 | Kirksey | 323,571 |
| 107 | H3 Hardy Collaboration Architecture | 305,903 |
| 108 | Hnedak Bobo Group | 301,000 |
| 109 | TEG Architects | 235,686 |
| 110 | RBB Architects | 215,897 |
| 111 | BBS Architects | 200,030 |
| 112 | DLA Architects | 133,140 |
| 113 | Fanning/Howey Associates | 50,000 |
| 114 | BSA LifeStructures | 41,019 |
| 115 | ai Design Group | 33,048 |
Top Government Sector Engineering Firms
| Rank | Company | 2013 Government Revenue |
| 1 | Fluor Corporation | $2,675,202,710 |
| 2 | URS Corp. | 648,982,536 |
| 3 | AECOM Technology Corp. | 574,020,000 |
| 4 | Jacobs | 287,190,693 |
| 5 | STV | 168,948,000 |
| 6 | Burns & McDonnell | 99,462,332 |
| 7 | Parsons Brinckerhoff | 57,994,366 |
| 8 | Leidos | 55,125,000 |
| 9 | H&A Architects & Engineers | 38,735,000 |
| 10 | Allen & Shariff | 33,964,317 |
| 11 | Dewberry | 26,388,476 |
| 12 | Arup | 23,554,256 |
| 13 | Smith Seckman Reid | 19,741,666 |
| 14 | Simpson Gumpertz & Heger | 19,066,000 |
| 15 | Affiliated Engineers | 15,598,000 |
| 16 | Syska Hennessy Group | 12,155,407 |
| 17 | Thornton Tomasetti | 10,996,123 |
| 18 | Coffman Engineers | 10,676,374 |
| 19 | KPFF Consulting Engineers | 10,500,000 |
| 20 | RMF Engineering | 10,000,000 |
| 21 | Guernsey | 9,680,758 |
| 22 | Shive-Hattery | 9,029,738 |
| 23 | Walker Parking Consultants | 8,925,000 |
| 24 | Bridgers & Paxton Consulting Engineers | 8,780,161 |
| 25 | WSP Group | 8,060,000 |
| 26 | Interface Engineering | 6,809,917 |
| 27 | Glumac | 6,650,738 |
| 28 | Joseph R. Loring & Associates | 6,500,000 |
| 29 | Wiss, Janney, Elstner Associates | 5,870,000 |
| 30 | TTG | 5,811,850 |
| 31 | Graef | 5,387,348 |
| 32 | KJWW Engineering Consultants | 5,191,493 |
| 33 | TLC Engineering for Architecture | 5,134,526 |
| 34 | Heapy Engineering | 5,072,001 |
| 35 | Ross & Baruzzini | 4,975,183 |
| 36 | I. C. Thomasson Associates | 4,750,000 |
| 37 | KCI Technologies | 4,600,000 |
| 38 | Vanderweil Engineers | 4,565,800 |
| 39 | Degenkolb Engineers | 4,462,450 |
| 40 | GRW | 3,753,047 |
| 41 | Sparling | 3,690,424 |
| 42 | H.F. Lenz | 3,559,848 |
| 43 | Barge Waggoner Sumner & Cannon | 3,495,000 |
| 44 | SSOE Group | 3,332,408 |
| 45 | Newcomb & Boyd | 3,140,130 |
| 46 | M/E Engineering | 3,096,775 |
| 47 | Henderson Engineers | 2,989,363 |
| 48 | RDK Engineers | 2,880,000 |
| 49 | Apogee Consulting Group | 2,732,049 |
| 50 | Spectrum Engineers | 2,497,641 |
| 51 | Brinjac Engineering | 2,083,384 |
| 52 | M-E Engineers | 2,000,000 |
| 53 | Davis, Bowen & Friedel | 1,610,242 |
| 54 | Walter P Moore and Associates | 1,441,663 |
| 55 | Rist-Frost-Shumway Engineering | 1,350,000 |
| 56 | CTLGroup | 1,330,000 |
| 57 | GHT Limited | 1,300,000 |
| 58 | French & Parrello Associates | 1,213,200 |
| 59 | Dunham Associates | 1,200,000 |
| 60 | AKF Group | 1,186,000 |
| 61 | Highland Associates | 1,150,000 |
| 62 | Paulus, Sokolowski and Sartor | 1,015,000 |
| 63 | Environmental Systems Design | 920,969 |
| 64 | BR+A Consulting Engineers | 920,000 |
| 65 | Aon Fire Protection Engineering Corp. | 918,914 |
| 66 | CJL Engineering | 870,000 |
| 67 | Mazzetti | 831,363 |
| 68 | Primera Engineers | 775,000 |
| 69 | ThermalTech Engineering | 750,000 |
| 70 | KLH Engineers | 480,951 |
| 71 | OLA Consulting Engineers | 262,000 |
| 72 | Zak Companies | 208,120 |
| 73 | Wick Fisher White | 195,530 |
| 74 | Wallace Engineering | 150,000 |
| 75 | Total Building Commissioning | 122,935 |
| 76 | G&W Engineering Corp. | 109,200 |
| 77 | P2S Engineering | 99,369 |
| 78 | DeSimone Consulting Engineers | 90,000 |
| 79 | Stanley Consultants | 74,747 |
| 80 | Integrated Design Group | 55,650 |
Top Government Sector Construction Firms
| Rank | Company | 2013 Government Revenue |
| 1 | Turner Construction | $2,343,544,729 |
| 2 | Clark Group | 2,342,085,755 |
| 3 | PCL Construction | 1,343,431,142 |
| 4 | Walsh Group, The | 1,188,110,497 |
| 5 | Hensel Phelps | 1,184,760,000 |
| 6 | Balfour Beatty US | 1,145,573,619 |
| 7 | Gilbane | 814,257,000 |
| 8 | Tutor Perini Corp. | 767,580,319 |
| 9 | McCarthy Holdings | 738,000,000 |
| 10 | Lend Lease | 551,622,000 |
| 11 | Skanska USA | 493,318,641 |
| 12 | Whiting-Turner Contracting Co., The | 455,618,872 |
| 13 | Brasfield & Gorrie | 379,267,063 |
| 14 | JE Dunn Construction | 321,764,977 |
| 15 | Hunt Construction Group | 277,300,000 |
| 16 | Mortenson Construction | 178,340,000 |
| 17 | STV | 168,948,000 |
| 18 | Hunt Companies | 154,387,811 |
| 19 | Sundt Construction | 153,006,199 |
| 20 | HITT Contracting | 145,900,000 |
| 21 | O'Neil Industries/W.E. O'Neil | 142,005,318 |
| 22 | CORE Construction Group | 135,900,848 |
| 23 | Manhattan Construction | 126,300,000 |
| 24 | Heery International | 125,058,364 |
| 25 | W. M. Jordan Company | 117,481,667 |
| 26 | Yates Companies, The | 111,200,000 |
| 27 | Holder Construction | 110,063,000 |
| 28 | Flintco | 106,026,635 |
| 29 | Hoffman Construction | 84,474,600 |
| 30 | Messer Construction | 79,799,220 |
| 31 | B. L. Harbert International | 74,365,423 |
| 32 | Consigli Construction | 74,312,383 |
| 33 | James G. Davis Construction | 72,010,706 |
| 34 | Suffolk Construction | 67,717,700 |
| 35 | DPR Construction | 65,709,181 |
| 36 | Coakley & Williams Construction | 61,953,906 |
| 37 | C.W. Driver | 58,850,000 |
| 38 | Parsons Brinckerhoff | 57,994,366 |
| 39 | Ryan Companies US | 57,693,535 |
| 40 | Fortis Construction | 52,585,000 |
| 41 | Shawmut Design and Construction | 49,000,000 |
| 42 | Leopardo Companies | 47,786,003 |
| 43 | Bernards | 46,000,000 |
| 44 | Swinerton Builders | 45,394,000 |
| 45 | Walbridge | 41,300,000 |
| 46 | Hill International | 41,000,000 |
| 47 | Power Construction | 39,000,000 |
| 48 | Kitchell Corp. | 38,162,513 |
| 49 | KBE Building Corp. | 37,661,458 |
| 50 | Beck Group, The | 36,300,176 |
| 51 | Allen & Shariff | 33,964,317 |
| 52 | Barton Malow | 33,108,673 |
| 53 | Wight & Company | 32,543,000 |
| 54 | Haselden Construction | 32,300,743 |
| 55 | Absher Construction | 31,202,850 |
| 56 | Structure Tone | 29,981,000 |
| 57 | Hoar Construction | 29,474,000 |
| 58 | Hathaway Dinwiddie Construction | 29,000,000 |
| 59 | New South Construction | 28,999,000 |
| 60 | Haskell | 28,573,183 |
| 61 | S. M. Wilson & Co. | 28,521,558 |
| 62 | Robins & Morton | 28,415,079 |
| 63 | Harkins Builders | 28,400,000 |
| 64 | EMJ Corp. | 21,000,000 |
| 65 | LeChase Construction Services | 19,680,000 |
| 66 | Bomel Construction | 19,327,000 |
| 67 | Layton Construction | 17,900,000 |
| 68 | Adolfson & Peterson Construction | 17,884,760 |
| 69 | McShane Companies, The | 17,672,043 |
| 70 | BlueScope Construction | 14,554,879 |
| 71 | Juneau Construction | 11,405,546 |
| 72 | Hill & Wilkinson | 10,864,000 |
| 73 | E.W. Howell | 9,541,000 |
| 74 | James McHugh Construction | 8,334,048 |
| 75 | Choate Construction | 7,670,062 |
| 76 | Weitz Company, The | 6,600,000 |
| 77 | JLL | 6,000,000 |
| 78 | Stalco Construction | 5,620,500 |
| 79 | LPCiminelli | 4,790,613 |
| 80 | Kraus-Anderson Construction | 3,000,000 |
| 81 | Bette Companies, The | 2,697,000 |
| 82 | Astorino | 2,384,468 |
| 83 | Batson-Cook | 1,390,120 |
| 84 | Graycor | 1,152,668 |
| 85 | Alberici Constructors | 1,080,320 |
| 86 | Paric Corp. | 1,000,000 |
| 87 | IMC Construction | 75,000 |
Read BD+C's full 2014 Giants 300 Report
Related Stories

Building Team Awards | Jun 1, 2016
Multifamily tower and office building revitalize Philadelphia cathedral
The Philadelphia Episcopal Cathedral capitalizes on hot property to help fund much needed upgrades and programs.

Building Team Awards | Jun 1, 2016
Central utility power plant takes center stage at UC San Diego Jacobs Medical Center
An undulating roof, floor-to-ceiling glass, and façade scheme give visual appeal to a plant that serves the 10-story medical center.

Architects | May 31, 2016
JLG Architects acquires Minneapolis-based Studio Five Architects
Led by Linda McCracken-Hunt, SFA is one of Minnesota’s oldest woman-owned architecture firms.

Building Team Awards | May 31, 2016
Gonzaga's new student center is a bustling social hub
Retail mall features, comfortable furniture, and floor-to-ceiling glass add vibrancy to the new John J. Hemmingson Center.
Building Team Awards | May 27, 2016
Big police academy trains thousands of New York's finest
The Police Training Academy in Queens, N.Y., consists of a 480,000-sf academic/administration building and a 240,000-sf physical training facility, linked by an aerial pedestrian bridge.
Building Team Awards | May 26, 2016
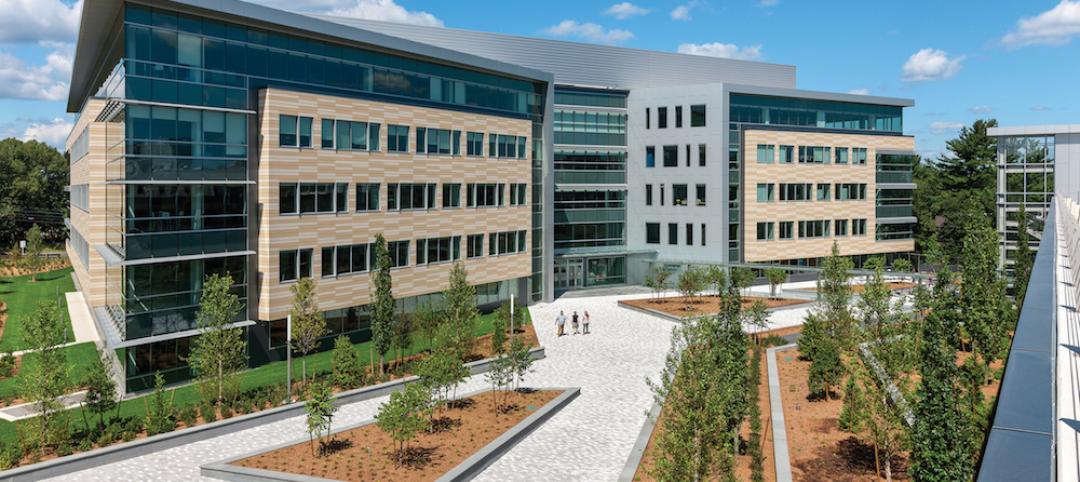
Cimpress office complex built during historically brutal Massachusetts winter
Lean construction techniques were used to build 275 Wyman Street during a winter that brought more than 100 inches of snow to suburban Boston.

Building Team Awards | May 25, 2016
New health center campus provides affordable care for thousands of Northern Californians
The 38,000-sf, two-level John & Susan Sobrato Campus in Palo Alto is expected to serve 25,000 patients a year by the end of the decade.
Architects | May 24, 2016
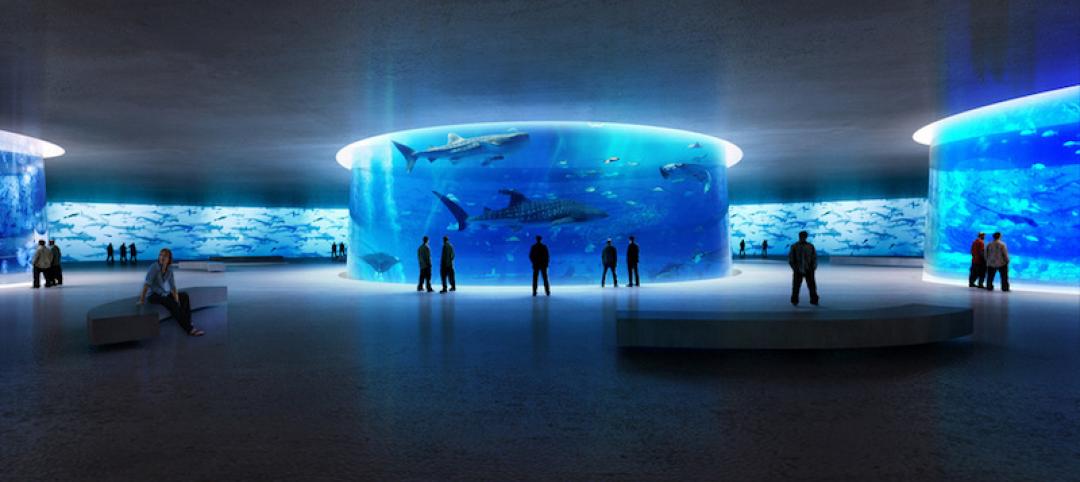
Lissoni Architettura’s NYC Aquatrium takes first place in New York City Waterfront Design competition
NYC Aquatrium was selected from among 178 proposals from 40 countries as the winner of Arch Out Loud’s NYC Aquarium & Public Waterfront design competition

Building Team Awards | May 24, 2016
Los Angeles bus depot squeezes the most from a tight site
The Building Team for the MTA Division 13 Bus Operations and Maintenance Facility fit 12 acres’ worth of programming in a multi-level structure on a 4.8-acre site.

Building Team Awards | May 23, 2016
'Greenest ballpark' proves a winner for St. Paul Saints
Solar arrays, a public art courtyard, and a picnic-friendly “park within a park" make the 7,210-seat CHS Field the first ballpark to meet Minnesota sustainable building standards.


