

 Regional Transportation Intermodal Center is a project of the cit")
Federal, state, and local government construction hasn’t exactly been a steamroller for the past few years, due to the end of stimulus availability and the ongoing effects of budget sequestration.
At press time, the most recent Commerce Department report indicated that government construction spending was up just under 1% in April, to a seasonally adjusted annual rate of $267 billion, despite overall economic contraction of about 1% in the first quarter. Federal construction spending was the growth leader, rising by 1.9% to a rate of $23.5 billion. State and local projects—a much larger piece of the public pie—were up just 0.7%, to $243.5 billion.
Among non-infrastructure public construction spending categories, healthcare (up 6%) and education (up 2%) appear most promising for this year, according to the Associated Builders and Contractors’ 2014 forecast.
Improving energy performance of existing properties through targeted upgrades—and, sometimes, large-scale reconstruction—continues to be a federal priority. Of 20 projects recently honored by the General Services Administration’s Design Awards program, half were reconstruction jobs, ranging from Beaux Arts courthouses to Modernist offices.
Along with the push for energy efficiency, federal agencies are increasingly exploring telework as an alternative to expanding office space. The bright side? Telecom and AV renovations will be required to help agencies keep off-site staff connected.
Many state and local governments continue to struggle with the sluggish overall economy, causing delays in needed construction. Among the discernible themes among state and local projects submitted to BD+C: new police facilities (designed to reflect changing ideas about community policing), replacement and upgraded courthouses, and mass-transit stations.
Top Government Sector Architecture Firms
| Rank | Company | 2013 Government Revenue |
| 1 | Stantec | $144,299,056 |
| 2 | Heery International | 125,058,364 |
| 3 | HOK | 114,753,666 |
| 4 | SmithGroupJJR | 83,064,158 |
| 5 | HDR | 81,601,164 |
| 6 | Skidmore, Owings & Merrill | 57,835,664 |
| 7 | SHW Group | 56,007,000 |
| 8 | Gensler | 52,272,600 |
| 9 | EYP Architecture & Engineering | 42,800,000 |
| 10 | RS&H | 39,200,000 |
| 11 | Page | 38,704,000 |
| 12 | Moseley Architects | 35,135,469 |
| 13 | Leo A Daly | 29,483,542 |
| 14 | Perkins+will | 28,975,375 |
| 15 | Clark Nexsen | 28,873,388 |
| 16 | ZGF Architects | 27,425,548 |
| 17 | CannonDesign | 27,000,000 |
| 18 | FreemanWhite | 25,941,154 |
| 19 | NBBJ | 19,382,000 |
| 20 | DLR Group | 19,300,000 |
| 21 | Hammel, Green and Abrahamson | 19,167,839 |
| 22 | EwingCole | 17,300,000 |
| 23 | HKS | 17,247,862 |
| 24 | PGAL | 16,097,917 |
| 25 | HNTB Corp. | 15,269,498 |
| 26 | Westlake Reed Leskosky | 15,049,000 |
| 27 | Quattrocchi Kwok Architects | 13,230,000 |
| 28 | Hoefer Wysocki Architecture | 12,860,000 |
| 29 | Fentress Architects | 12,160,971 |
| 30 | BLDD Architects | 11,800,000 |
| 31 | RTKL Associates | 11,469,000 |
| 32 | SchenkelShultz Architecture | 11,278,000 |
| 33 | NORR | 9,792,248 |
| 34 | LS3P | 8,882,375 |
| 35 | Morris Architects | 8,350,000 |
| 36 | Davis Brody Bond | 8,263,108 |
| 37 | LaBella Associates | 8,130,000 |
| 38 | CTA Architects Engineers | 8,014,884 |
| 39 | Beyer Blinder Belle | 7,947,688 |
| 40 | HMC Architects | 6,811,005 |
| 41 | VOA Associates | 6,808,200 |
| 42 | Parkhill, Smith & Cooper | 6,687,000 |
| 43 | Rosser International | 6,652,324 |
| 44 | LMN Architects | 6,388,100 |
| 45 | Sherlock, Smith & Adams | 6,388,000 |
| 46 | Becker Morgan Group | 6,343,277 |
| 47 | Flad Architects | 6,126,870 |
| 48 | KZF Design | 5,887,462 |
| 49 | Epstein | 5,402,000 |
| 50 | IBI Group ? Gruzen Samton | 5,000,000 |
| 51 | Solomon Cordwell Buenz | 4,500,000 |
| 52 | Goodwyn Mills & Cawood | 4,409,249 |
| 53 | Wight & Company | 4,402,093 |
| 54 | RSP Architects | 4,326,000 |
| 55 | Harley Ellis Devereaux | 4,310,000 |
| 56 | Carrier Johnson + Culture | 4,066,891 |
| 57 | BRPH | 3,957,000 |
| 58 | FGM Architects | 3,776,698 |
| 59 | Ennead Architects | 3,729,000 |
| 60 | RNL | 3,418,000 |
| 61 | WDG Architecture | 3,095,000 |
| 62 | Perkins Eastman | 3,000,000 |
| 63 | GWWO | 2,965,804 |
| 64 | Gresham, Smith and Partners | 2,787,930 |
| 65 | Integrus Architecture | 2,705,119 |
| 66 | Hoffmann Architects | 2,654,000 |
| 67 | Swanke Hayden Connell Architects | 2,534,000 |
| 68 | Ratio Architects | 2,462,355 |
| 69 | LPA | 2,205,538 |
| 70 | Emersion Design | 2,183,039 |
| 71 | Array Architects | 2,138,000 |
| 72 | WHR Architects | 2,076,445 |
| 73 | Cooper Carry | 1,987,669 |
| 74 | Little | 1,961,000 |
| 75 | Bergmann Associates | 1,941,360 |
| 76 | OZ Architecture | 1,724,680 |
| 77 | Legat Architects | 1,675,500 |
| 78 | LBL Architects | 1,600,000 |
| 79 | Schrader Group Architecture | 1,573,559 |
| 80 | Symmes Maini & McKee Associates | 1,563,000 |
| 81 | Good Fulton & Farrell | 1,373,500 |
| 82 | H+L Architecture | 1,295,496 |
| 83 | Harvard Jolly Architecture | 1,221,576 |
| 84 | Cambridge Seven Associates | 1,210,000 |
| 85 | FXFOWLE Architects | 1,180,000 |
| 86 | Smallwood, Reynolds, Stewart, Stewart & Associates | 1,128,560 |
| 87 | Moody Nolan | 1,083,924 |
| 88 | CO Architects | 1,031,600 |
| 89 | Shepley Bulfinch | 836,000 |
| 90 | Corgan | 762,894 |
| 91 | Cuningham Group Architecture | 742,891 |
| 92 | Lord Aeck Sargent | 742,273 |
| 93 | GBBN Architects | 660,000 |
| 94 | Nadel | 650,000 |
| 95 | Eppstein Uhen Architects | 640,751 |
| 96 | Commonwealth Architects | 599,591 |
| 97 | Hastings+Chivetta Architects | 491,188 |
| 98 | DesignGroup | 433,190 |
| 99 | Baskervill | 391,276 |
| 100 | Payette | 383,755 |
| 101 | Taylor Design | 372,052 |
| 102 | LawKingdon Architecture | 350,000 |
| 103 | Anderson Mikos Architects | 350,000 |
| 104 | NAC|Architecture | 345,476 |
| 105 | Environetics | 341,475 |
| 106 | Kirksey | 323,571 |
| 107 | H3 Hardy Collaboration Architecture | 305,903 |
| 108 | Hnedak Bobo Group | 301,000 |
| 109 | TEG Architects | 235,686 |
| 110 | RBB Architects | 215,897 |
| 111 | BBS Architects | 200,030 |
| 112 | DLA Architects | 133,140 |
| 113 | Fanning/Howey Associates | 50,000 |
| 114 | BSA LifeStructures | 41,019 |
| 115 | ai Design Group | 33,048 |
Top Government Sector Engineering Firms
| Rank | Company | 2013 Government Revenue |
| 1 | Fluor Corporation | $2,675,202,710 |
| 2 | URS Corp. | 648,982,536 |
| 3 | AECOM Technology Corp. | 574,020,000 |
| 4 | Jacobs | 287,190,693 |
| 5 | STV | 168,948,000 |
| 6 | Burns & McDonnell | 99,462,332 |
| 7 | Parsons Brinckerhoff | 57,994,366 |
| 8 | Leidos | 55,125,000 |
| 9 | H&A Architects & Engineers | 38,735,000 |
| 10 | Allen & Shariff | 33,964,317 |
| 11 | Dewberry | 26,388,476 |
| 12 | Arup | 23,554,256 |
| 13 | Smith Seckman Reid | 19,741,666 |
| 14 | Simpson Gumpertz & Heger | 19,066,000 |
| 15 | Affiliated Engineers | 15,598,000 |
| 16 | Syska Hennessy Group | 12,155,407 |
| 17 | Thornton Tomasetti | 10,996,123 |
| 18 | Coffman Engineers | 10,676,374 |
| 19 | KPFF Consulting Engineers | 10,500,000 |
| 20 | RMF Engineering | 10,000,000 |
| 21 | Guernsey | 9,680,758 |
| 22 | Shive-Hattery | 9,029,738 |
| 23 | Walker Parking Consultants | 8,925,000 |
| 24 | Bridgers & Paxton Consulting Engineers | 8,780,161 |
| 25 | WSP Group | 8,060,000 |
| 26 | Interface Engineering | 6,809,917 |
| 27 | Glumac | 6,650,738 |
| 28 | Joseph R. Loring & Associates | 6,500,000 |
| 29 | Wiss, Janney, Elstner Associates | 5,870,000 |
| 30 | TTG | 5,811,850 |
| 31 | Graef | 5,387,348 |
| 32 | KJWW Engineering Consultants | 5,191,493 |
| 33 | TLC Engineering for Architecture | 5,134,526 |
| 34 | Heapy Engineering | 5,072,001 |
| 35 | Ross & Baruzzini | 4,975,183 |
| 36 | I. C. Thomasson Associates | 4,750,000 |
| 37 | KCI Technologies | 4,600,000 |
| 38 | Vanderweil Engineers | 4,565,800 |
| 39 | Degenkolb Engineers | 4,462,450 |
| 40 | GRW | 3,753,047 |
| 41 | Sparling | 3,690,424 |
| 42 | H.F. Lenz | 3,559,848 |
| 43 | Barge Waggoner Sumner & Cannon | 3,495,000 |
| 44 | SSOE Group | 3,332,408 |
| 45 | Newcomb & Boyd | 3,140,130 |
| 46 | M/E Engineering | 3,096,775 |
| 47 | Henderson Engineers | 2,989,363 |
| 48 | RDK Engineers | 2,880,000 |
| 49 | Apogee Consulting Group | 2,732,049 |
| 50 | Spectrum Engineers | 2,497,641 |
| 51 | Brinjac Engineering | 2,083,384 |
| 52 | M-E Engineers | 2,000,000 |
| 53 | Davis, Bowen & Friedel | 1,610,242 |
| 54 | Walter P Moore and Associates | 1,441,663 |
| 55 | Rist-Frost-Shumway Engineering | 1,350,000 |
| 56 | CTLGroup | 1,330,000 |
| 57 | GHT Limited | 1,300,000 |
| 58 | French & Parrello Associates | 1,213,200 |
| 59 | Dunham Associates | 1,200,000 |
| 60 | AKF Group | 1,186,000 |
| 61 | Highland Associates | 1,150,000 |
| 62 | Paulus, Sokolowski and Sartor | 1,015,000 |
| 63 | Environmental Systems Design | 920,969 |
| 64 | BR+A Consulting Engineers | 920,000 |
| 65 | Aon Fire Protection Engineering Corp. | 918,914 |
| 66 | CJL Engineering | 870,000 |
| 67 | Mazzetti | 831,363 |
| 68 | Primera Engineers | 775,000 |
| 69 | ThermalTech Engineering | 750,000 |
| 70 | KLH Engineers | 480,951 |
| 71 | OLA Consulting Engineers | 262,000 |
| 72 | Zak Companies | 208,120 |
| 73 | Wick Fisher White | 195,530 |
| 74 | Wallace Engineering | 150,000 |
| 75 | Total Building Commissioning | 122,935 |
| 76 | G&W Engineering Corp. | 109,200 |
| 77 | P2S Engineering | 99,369 |
| 78 | DeSimone Consulting Engineers | 90,000 |
| 79 | Stanley Consultants | 74,747 |
| 80 | Integrated Design Group | 55,650 |
Top Government Sector Construction Firms
| Rank | Company | 2013 Government Revenue |
| 1 | Turner Construction | $2,343,544,729 |
| 2 | Clark Group | 2,342,085,755 |
| 3 | PCL Construction | 1,343,431,142 |
| 4 | Walsh Group, The | 1,188,110,497 |
| 5 | Hensel Phelps | 1,184,760,000 |
| 6 | Balfour Beatty US | 1,145,573,619 |
| 7 | Gilbane | 814,257,000 |
| 8 | Tutor Perini Corp. | 767,580,319 |
| 9 | McCarthy Holdings | 738,000,000 |
| 10 | Lend Lease | 551,622,000 |
| 11 | Skanska USA | 493,318,641 |
| 12 | Whiting-Turner Contracting Co., The | 455,618,872 |
| 13 | Brasfield & Gorrie | 379,267,063 |
| 14 | JE Dunn Construction | 321,764,977 |
| 15 | Hunt Construction Group | 277,300,000 |
| 16 | Mortenson Construction | 178,340,000 |
| 17 | STV | 168,948,000 |
| 18 | Hunt Companies | 154,387,811 |
| 19 | Sundt Construction | 153,006,199 |
| 20 | HITT Contracting | 145,900,000 |
| 21 | O'Neil Industries/W.E. O'Neil | 142,005,318 |
| 22 | CORE Construction Group | 135,900,848 |
| 23 | Manhattan Construction | 126,300,000 |
| 24 | Heery International | 125,058,364 |
| 25 | W. M. Jordan Company | 117,481,667 |
| 26 | Yates Companies, The | 111,200,000 |
| 27 | Holder Construction | 110,063,000 |
| 28 | Flintco | 106,026,635 |
| 29 | Hoffman Construction | 84,474,600 |
| 30 | Messer Construction | 79,799,220 |
| 31 | B. L. Harbert International | 74,365,423 |
| 32 | Consigli Construction | 74,312,383 |
| 33 | James G. Davis Construction | 72,010,706 |
| 34 | Suffolk Construction | 67,717,700 |
| 35 | DPR Construction | 65,709,181 |
| 36 | Coakley & Williams Construction | 61,953,906 |
| 37 | C.W. Driver | 58,850,000 |
| 38 | Parsons Brinckerhoff | 57,994,366 |
| 39 | Ryan Companies US | 57,693,535 |
| 40 | Fortis Construction | 52,585,000 |
| 41 | Shawmut Design and Construction | 49,000,000 |
| 42 | Leopardo Companies | 47,786,003 |
| 43 | Bernards | 46,000,000 |
| 44 | Swinerton Builders | 45,394,000 |
| 45 | Walbridge | 41,300,000 |
| 46 | Hill International | 41,000,000 |
| 47 | Power Construction | 39,000,000 |
| 48 | Kitchell Corp. | 38,162,513 |
| 49 | KBE Building Corp. | 37,661,458 |
| 50 | Beck Group, The | 36,300,176 |
| 51 | Allen & Shariff | 33,964,317 |
| 52 | Barton Malow | 33,108,673 |
| 53 | Wight & Company | 32,543,000 |
| 54 | Haselden Construction | 32,300,743 |
| 55 | Absher Construction | 31,202,850 |
| 56 | Structure Tone | 29,981,000 |
| 57 | Hoar Construction | 29,474,000 |
| 58 | Hathaway Dinwiddie Construction | 29,000,000 |
| 59 | New South Construction | 28,999,000 |
| 60 | Haskell | 28,573,183 |
| 61 | S. M. Wilson & Co. | 28,521,558 |
| 62 | Robins & Morton | 28,415,079 |
| 63 | Harkins Builders | 28,400,000 |
| 64 | EMJ Corp. | 21,000,000 |
| 65 | LeChase Construction Services | 19,680,000 |
| 66 | Bomel Construction | 19,327,000 |
| 67 | Layton Construction | 17,900,000 |
| 68 | Adolfson & Peterson Construction | 17,884,760 |
| 69 | McShane Companies, The | 17,672,043 |
| 70 | BlueScope Construction | 14,554,879 |
| 71 | Juneau Construction | 11,405,546 |
| 72 | Hill & Wilkinson | 10,864,000 |
| 73 | E.W. Howell | 9,541,000 |
| 74 | James McHugh Construction | 8,334,048 |
| 75 | Choate Construction | 7,670,062 |
| 76 | Weitz Company, The | 6,600,000 |
| 77 | JLL | 6,000,000 |
| 78 | Stalco Construction | 5,620,500 |
| 79 | LPCiminelli | 4,790,613 |
| 80 | Kraus-Anderson Construction | 3,000,000 |
| 81 | Bette Companies, The | 2,697,000 |
| 82 | Astorino | 2,384,468 |
| 83 | Batson-Cook | 1,390,120 |
| 84 | Graycor | 1,152,668 |
| 85 | Alberici Constructors | 1,080,320 |
| 86 | Paric Corp. | 1,000,000 |
| 87 | IMC Construction | 75,000 |
Read BD+C's full 2014 Giants 300 Report
Related Stories

Architects | May 20, 2016
NCARB survey indicates continued growth of U.S. architects
The number of U.S. architects surpassed 110,000 in 2015, a 2% increase from the previous year.

Multifamily Housing | May 19, 2016
Architect Jean Nouvel designs flood-resilient Monad Terrace in Miami Beach
A man-made lagoon with lush vegetation at the base of the complex is expected to adapt to climate change and rising sea levels.
Building Team Awards | May 19, 2016
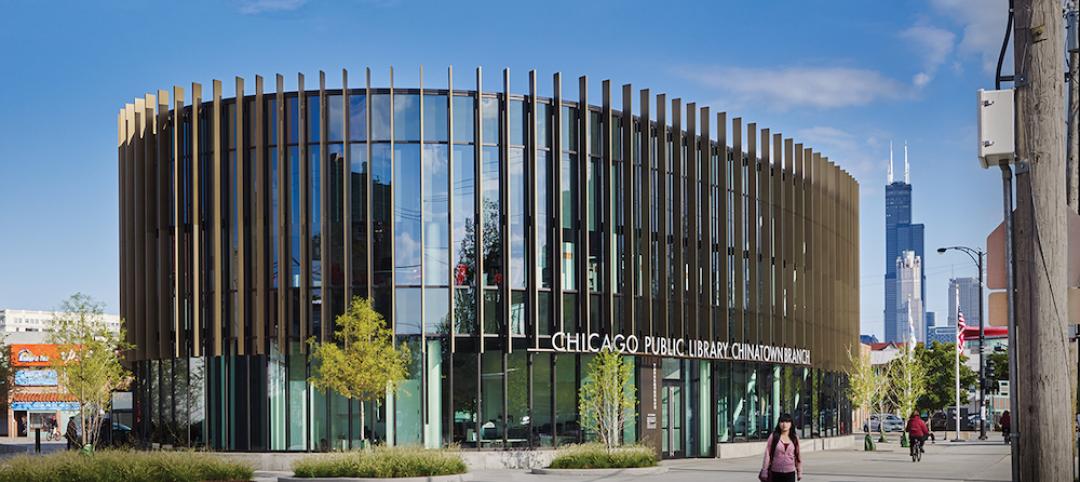
Chinatown library unites and serves two emerging Chicago neighborhoods
The 16,000-sf, pebble-shaped Chinatown Branch Library was built at the intersection of new and old Chinatown neighborhoods. The goal is for the building to unite the communities and serve as a catalyst for the developing area.
Building Team Awards | May 19, 2016
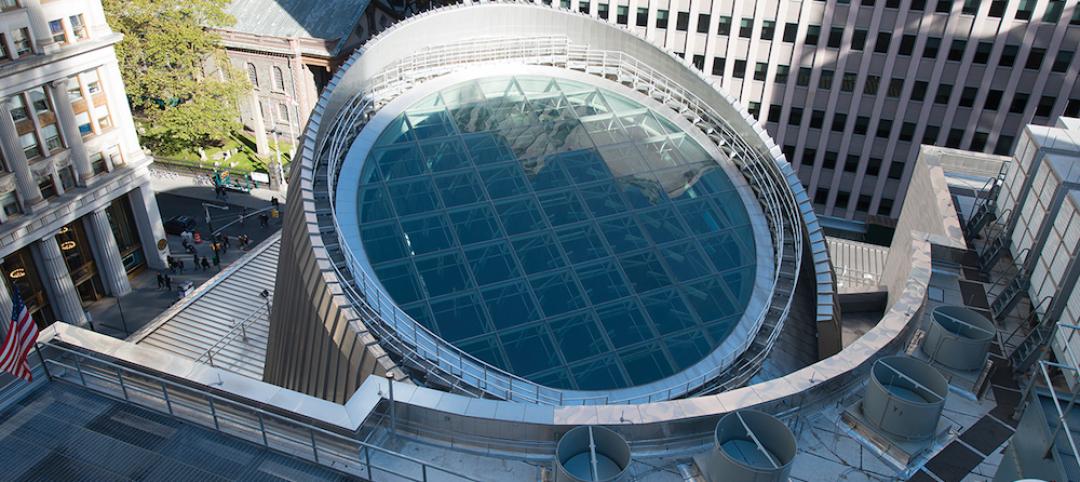
NYC subway station lights the way for 300,000 riders a day
Fulton Center, which handles 85% of the riders coming to Lower Manhattan, is like no other station in the city’s vast underground transit web—and that’s a good thing.
Market Data | May 17, 2016
Modest growth for AIA’s Architecture Billings Index in April
The American Institute of Architects reported the April ABI score was 50.6, down from the mark of 51.9 in the previous month. This score still reflects an increase in design services.

Architects | May 16, 2016
AIA and HOK partner to advance Design and Health Research Consortium
The groups' key priority is to identify and develop practice-focused opportunities for funded research, publications, and tools in the area of design and public health.

Senior Living Design | May 16, 2016
Perkins Eastman releases white paper on biophilic design in senior living
The paper highlights some of the firm's top projects that feature biophilic design, a sustainable architecture strategy that connects people with nature.
Architects | May 16, 2016
3 strategies to creating environments that promote workplace engagement
VOA's Pablo Quintana writes that the industry is looking for ways to increase engagement through a mix of spaces suited to employees' desire for both privacy and connection.

Architects | May 11, 2016
AIA to create a resilience curriculum for architects
The program will teach resilient design and decision-making on hazard mitigation, climate adaptation and community resilience.

Retail Centers | May 10, 2016
5 factors guiding restaurant design
Restaurants are more than just places to eat. They are comprising town centers and playing into the future of brick-and-mortar retail.


