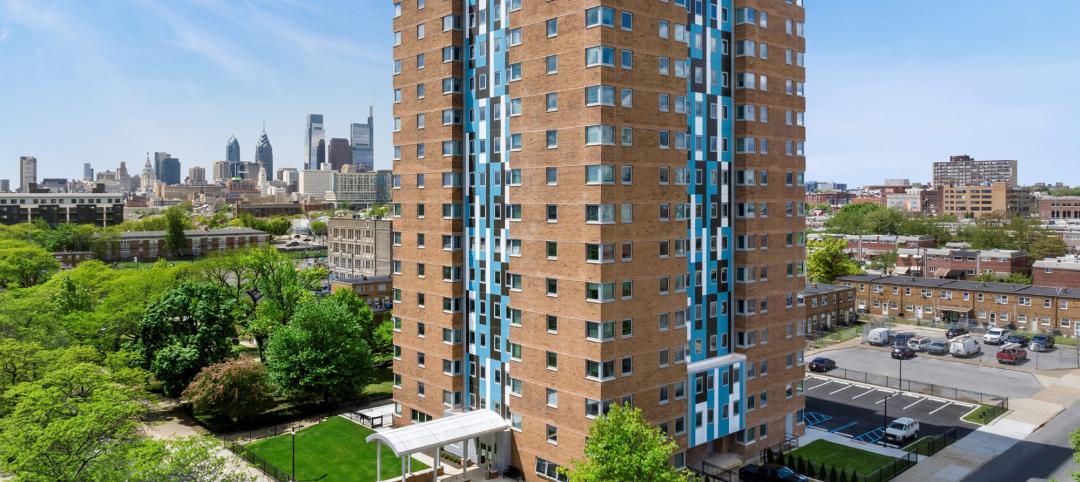
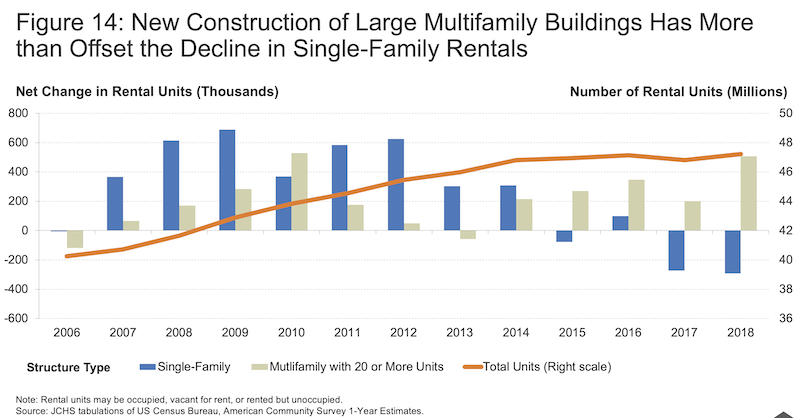
Starts of buildings with five or more housing units rose from December 2018 through December 2019 by 74.6% to a seasonally adjusted annual rate of 536,000, according to preliminary Census Bureau estimates. At the end of that period, the number of multifamily housing units under construction was up 7.3% to 177,000.
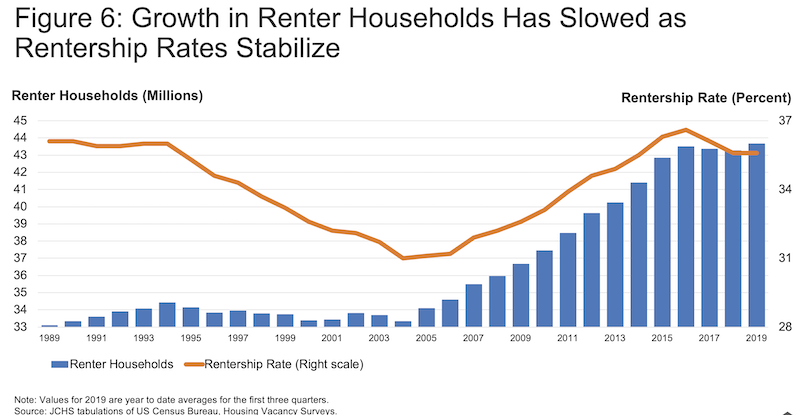
However, the seemingly endless demand for multifamily housing could finally be abating. After more than a decade-long runup, renter household growth appears to have plateaued. By the Housing Vacancy Survey’s count, the number of renters fell by a total of 222,000 between 2016 and 2018, but then more than made up for this lost ground with a gain of 350,000 through the first three quarters of 2019.
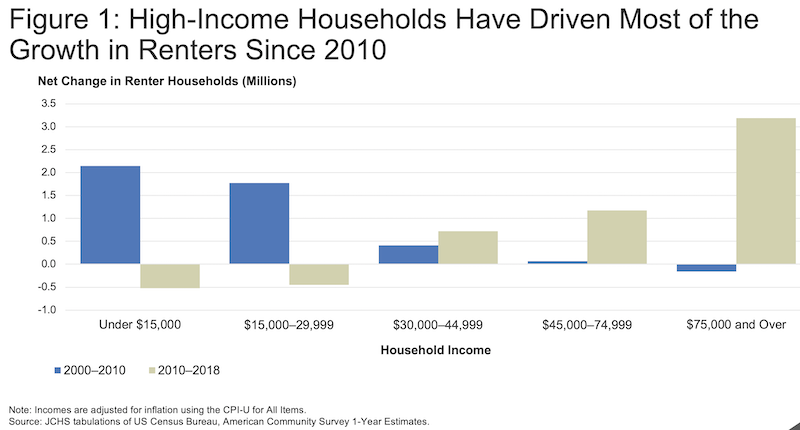
The National Association of Home Builders recently projected that multifamily housing starts would increase by only 1% in 2020. And what’s getting built in most markets is targeting higher-income renters, whose numbers increased by 545,000 in 2016–2018 alone. In fact, households with real incomes of at least $75,000 accounted for over three-quarters of the growth in renters (3.2 million) from 2010 to 2018,
Those are some of the findings in “America’s Rental Housing 2020,” the annual report released today by the Joint Center for Housing Studies of Harvard University. The John D. and Catherine T. MacArthur Foundation and the Joint Center’s Policy Advisory Board provided the funding for the report.
The report provides a rearview mirror perspective on the country’s rental landscape, where renting has become far more common and acceptable among the age groups and family types traditionally more likely to own their housing. For example, from the homeownership peak in 2004 to 2018, the number of married couples with children who owned homes fell by 2.7 million, while the number renting rose by 680,000.
Charts: Joint Center for Housing Studies at Harvard University
The increase in renting among high-income, older, and larger households reflects fundamental shifts in the composition of demand.
The American Dream of owning a house isn’t waning, necessarily. Public opinion surveys indicate that most renters are satisfied with their current housing situations, but still desire to eventually own homes. However, these same surveys also point to affordability as a major barrier to homeownership. Consistent with this finding, nearly all of the net growth in homeowners from 2010 to 2018 was among households with incomes of $150,000 or more.
“Rising rents are making it increasingly difficult for households to save for a downpayment and become homeowners,” says Whitney Airgood-Obrycki, a Research Associate at the Joint Center and lead author of the new report. “Young, college-educated households with high incomes are really driving current rental demand."
New rental construction remains near its highest levels in three decades. The share of newly completed apartments in structures with 50 or more units increased steadily from 11 percent in the 1990s, to 27 percent in the 2000s, to 61 percent in 2018.
Nearly all new multifamily units are built as rentals, with a growing share in larger buildings intended for the high end of the market. So it’s not surprising that rents continue to escalate.
The Joint Center estimates that the median asking rent for unfurnished units completed between July 2018 and June 2019 was $1,620—some 37% higher, in real terms, than the median for units completed in 2000. About one in five newly built apartments had an asking rent of at least $2,450, while only 12% had asking rents below $1,050.
Rents have been trending upward for a while. Between 2012 and 2017, the number of units renting for $1,000 or more in real terms shot up by five million, while the number of low-cost units renting for under $600 fell by 3.1 million. The supply of units with rents in the $600–$999 range also declined, but by a more modest 450,000. This marks a sharp departure from the preceding five-year period, when the number of units in all three rent segments grew by 1.2 to 1.8 million.
Low-cost rental units accounted for only 25% of the national rental stock in 2017, compared to 33% in 2012, with decreases in all 50 states and Washington, DC.
Contributing to rent escalation has been supply. Even as overall rental demand ebbs and new supply comes online, tight conditions prevail across the country. The Census Bureau reports that the national rental vacancy rate edged down again in mid-2019 to 6.8%—the lowest level since the mid-1980s.
According to RealPage, vacancy rates for units in professionally managed properties were down in 118 of the 150 markets tracked, with year-over-year declines averaging 0.7 percentage point in the third quarter of 2019.
With vacancy rates so low, rent gains continue to outrun general inflation. The Consumer Price Index for rent of primary residence was up 3.7% year-over-year in the third quarter of 2019, far outpacing the 1.1% increase in prices for all non-housing items over the same period. This brought the number of consecutive quarters of real rent growth to 29, the second-longest streak in records dating back to the 1940s.
RealPage reports that apartment rents in 142 of 150 metros rose from the third quarter of 2018 to the third quarter of 2019.
Thanks to strong growth in the number of high-income renters, the share of renters with cost burdens—i.e., those paying more than 30% of their household incomes for rent—fell more noticeably from a peak of 50.7% in 2011 to 47.4% in 2017, followed by a modest 0.1 percentage point increase in 2018. That year, there were six million more cost-burdened renters than in 2001 and the cost-burdened share was nearly 7 percentage points higher.
Meanwhile, 10.9 million renters—or one in four—spent more than half their incomes on housing in 2018.
Even as the overall share of cost-burdened renters has receded somewhat, the share of middle-income renters paying more than 30% of income for housing has steadily risen. While the improving economy has increased the share of middle-income renters, earnings growth has not caught up with the rise in rents.
Housing expense is also a burden that a sizable number of people simply can’t bear. After falling for six straight years, the number of people experiencing homelessness nationwide turned upward in 2016–2018, to 552,830. Much of this reversal reflects an 18,110 jump in the number of homeless individuals living outside or in places not intended for human habitation, with particularly large increases in the high-cost states of California, Oregon, and Washington.
Climate change is also playing havoc on the country’s housing landscape. The Joint Center estimates that 10.5 million renter households—one quarter of the total—live in zip codes with at least $1 million in home and business losses in 2008–2018 due to natural disasters.
As the nation’s rental affordability crisis evolves, efforts to address these challenges must evolve as well, the Joint Center states. However, the federal response has not kept up with need. HUD budget outlays for rental assistance programs grew from $37.4 billion in 2013 to $40.3 billion in 2018 in real terms, an average annual increase of just 1.5%. The shortfall in federal spending leaves about 75% of the 17.6 million eligible households without rental assistance.
State and local programs have attempted to fill these gaps in assistance by targeting low-income households without access to federal support. Chief among their efforts has been the issuance of $4.8 billion in tax-exempt bonds for multifamily housing in 2017–2018. Local governments have also passed reforms that mandate or incentivize new construction of affordable units, and 510 jurisdictions nationwide now have inclusionary zoning.
Related Stories
Sponsored | MFPRO+ Blog | Oct 26, 2023
Unlock New Potential—Can Multifamily Pop-Up Hotel Concepts Transform Lease-Ups?
Dive into the new trend of multifamily pop-up hotels! Learn how they're changing the game in lease-ups, creating vibrant communities, and offering property managers a lucrative new revenue stream. Join the conversation on the future of multifamily living spaces.
Giants 400 | Oct 23, 2023
Top 115 Multifamily Construction Firms for 2023
Clark Group, Suffolk Construction, Summit Contracting Group, Whiting-Turner Contracting, and McShane Companies top the ranking of the nation's largest multifamily housing sector contractors and construction management (CM) firms for 2023, as reported in Building Design+Construction's 2023 Giants 400 Report. Note: This ranking factors revenue for all multifamily buildings work, including apartments, condominiums, student housing facilities, and senior living facilities.
Giants 400 | Oct 23, 2023
Top 75 Multifamily Engineering Firms for 2023
Kimley-Horn, WSP, Tetra Tech, Olsson, and Langan head the ranking of the nation's largest multifamily housing sector engineering and engineering/architecture (EA) firms for 2023, as reported in Building Design+Construction's 2023 Giants 400 Report. Note: This ranking factors revenue for all multifamily buildings work, including apartments, condominiums, student housing facilities, and senior living facilities.
Giants 400 | Oct 23, 2023
Top 190 Multifamily Architecture Firms for 2023
Humphreys and Partners, Gensler, Solomon Cordwell Buenz, Niles Bolton Associates, and AO top the ranking of the nation's largest multifamily housing sector architecture and architecture/engineering (AE) firms for 2023, as reported in Building Design+Construction's 2023 Giants 400 Report. Note: This ranking factors revenue for all multifamily buildings work, including apartments, condominiums, student housing facilities, and senior living facilities.
Senior Living Design | Oct 19, 2023
Senior living construction poised for steady recovery
Senior housing demand, as measured by the change in occupied units, continued to outpace new supply in the third quarter, according to NIC MAP Vision. It was the ninth consecutive quarter of growth with a net absorption gain. On the supply side, construction starts continued to be limited compared with pre-pandemic levels.
MFPRO+ News | Oct 6, 2023
Announcing MultifamilyPro+
BD+C has served the multifamily design and construction sector for more than 60 years, and now we're introducing a central hub within BDCnetwork.com for all things multifamily.
Sponsored | Multifamily Housing | Sep 29, 2023
Win-Win Scenarios for Residents and Property Managers
Discover how proptech is opening open new paths to revenue for owners and property managers, while bringing desirable amenities and conveniences for renters. Check out my thoughts on profitable, resident-centric proptech.
Products and Materials | Sep 29, 2023
Top building products for September 2023
BD+C Editors break down 15 of the top building products this month, from smart light switches to glass wall systems.
Multifamily Housing | Sep 26, 2023
Midwest metros see greatest rent increase in September 2023
While the median monthly price of rent has increased by 0.71% in August, the year-over-year estimates show a national change of -0.06 percent.
Affordable Housing | Sep 25, 2023
3 affordable housing projects that serve as social catalysts
Trish Donnally, Associate Principal, Perkins Eastman, shares insights from three transformative affordable housing projects.


