HomeUnion has released a list of the most and least affordable rental housing markets in the U.S. Chicago tops the list as the most affordable metro, while Oakland, Calif., is the most expensive rental market, based on rent-to-income ratios.
“With its low cost of living, relatively large housing inventory levels and high affordability, Chicago is an excellent market for residents entering the renting pool,” says Steve Hovland, Director of Research for HomeUnion. It’s is the only metro in the country where typical renters spend less than 20% of their annual income on housing. Emerging neighborhoods like Logan Square and other West Side locations have become increasingly popular areas for young professionals, making Chicago an excellent choice for millennials.
The second location on HomeUnion’s list – Charlotte, N.C. – also has a low cost of living and high affordability, with average annual rents of under $16,000. “About one-quarter of the average income of a typical Charlotte resident goes to rental housing, making it appealing to millennials as well,” says Hovland.
Here’s a list of the 10 most affordable rental markets in the nation:
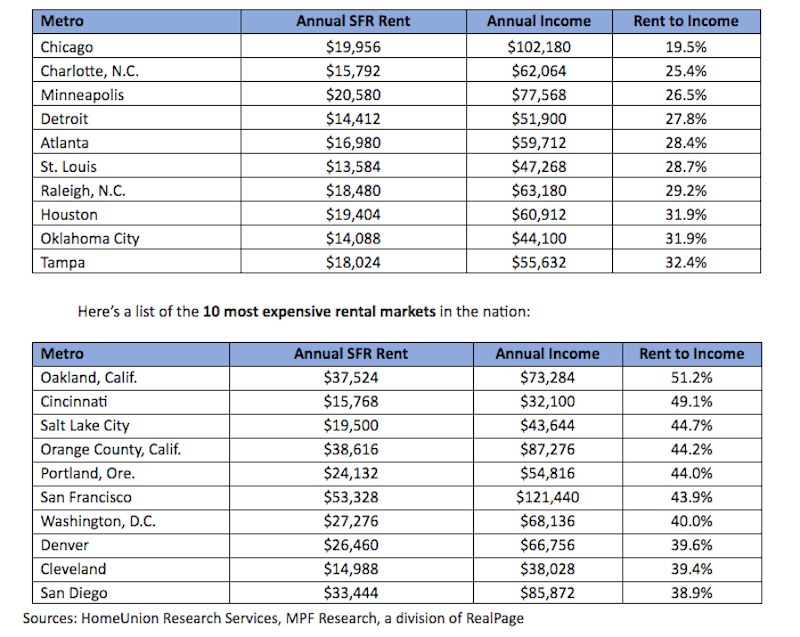
“Low affordability negatively impacts all renters in the Bay Area, Denver, Southern California and Washington, D.C., because of strong local job market conditions, intense demand for rental properties, and high mortgage costs for owner-occupied housing,” Hovland says.
Established and mature markets, such as Cincinnati and Cleveland, where home prices remain affordable, negatively impact renters’ wallets. “A significant number of potential young renters are migrating out of Ohio to Chicago or booming western metros such as Denver, the Bay Area and Los Angeles, leaving mostly low-wage earners to occupy rentals,” Hovland concludes.
Related Stories
MFPRO+ Research | Oct 15, 2024
Multifamily rents drop in September 2024
The average multifamily rent fell by $3 in September to $1,750, while year-over-year growth was unchanged at 0.9 percent.
Contractors | Oct 1, 2024
Nonresidential construction spending rises slightly in August 2024
National nonresidential construction spending increased 0.1% in August, according to an Associated Builders and Contractors analysis of data published today by the U.S. Census Bureau. On a seasonally adjusted annualized basis, nonresidential spending totaled $1.22 trillion.
The Changing Built Environment | Sep 23, 2024
Half-century real estate data shows top cities for multifamily housing, self-storage, and more
Research platform StorageCafe has conducted an analysis of U.S. real estate activity from 1980 to 2023, focusing on six major sectors: single-family, multifamily, industrial, office, retail, and self-storage.
Student Housing | Sep 17, 2024
Student housing market stays strong in summer 2024
As the summer season winds down, student housing performance remains strong. Preleasing for Yardi 200 schools rose to 89.2% in July 2024, falling just slightly behind the same period last year.
MFPRO+ Research | Sep 11, 2024
Multifamily rents fall for first time in 6 months
Ending its six-month streak of growth, the average advertised multifamily rent fell by $1 in August 2024 to $1,741.
Contractors | Sep 10, 2024
The average U.S. contractor has 8.2 months worth of construction work in the pipeline, as of August 2024
Associated Builders and Contractors reported today that its Construction Backlog Indicator fell to 8.2 months in August, according to an ABC member survey conducted Aug. 20 to Sept. 5. The reading is down 1.0 months from August 2023.
Construction Costs | Sep 2, 2024
Construction material decreases level out, but some increases are expected to continue for the balance Q3 2024
The Q3 2024 Quarterly Construction Insights Report from Gordian examines the numerous variables that influence material pricing, including geography, global events and commodity volatility. Gordian and subject matter experts examine fluctuations in costs, their likely causes, and offer predictions about where pricing is likely to go from here. Here is a sampling of the report’s contents.
Contractors | Aug 21, 2024
The average U.S. contractor has 8.4 months worth of construction work in the pipeline, as of July 2024
Associated Builders and Contractors reported today that its Construction Backlog Indicator held steady at 8.4 months in July, according to an ABC member survey conducted July 22 to Aug. 6. The reading is down 0.9 months from July 2023.
MFPRO+ Research | Aug 9, 2024
Apartment completions to surpass 500,000 for first time ever
While the U.S. continues to maintain a steady pace of delivering new apartments, this year will be one for the record books.
Contractors | Aug 1, 2024
Nonresidential construction spending decreased 0.2% in June
National nonresidential construction spending declined 0.2% in June, according to an Associated Builders and Contractors analysis of data published today by the U.S. Census Bureau. On a seasonally adjusted annualized basis, nonresidential spending totaled $1.21 trillion. Nonresidential construction has expanded 5.3% from a year ago.


