

Grumman|Butkus Associates, a firm of energy efficiency consultants and sustainable design engineers, recently released the results of its 2023 Hospital Energy and Water Benchmarking Survey, focusing on healthcare facilities’ resource usage trends and costs for calendar years 2021 and 2022.
For the first time, the report charts and historical data are available at a dedicated website, including pull-down menus for sorting data by facility characteristics (for instance, hospitals with purchased steam or in-house laundry). These tools will make it easier for users to make comparisons between the survey data and patterns in their own facilities.
Users can also choose some aspects of data presentation (for instance, $/therm vs. $/MMBtu in the fossil fuel energy chart).
Hospital Energy and Water Use Trends
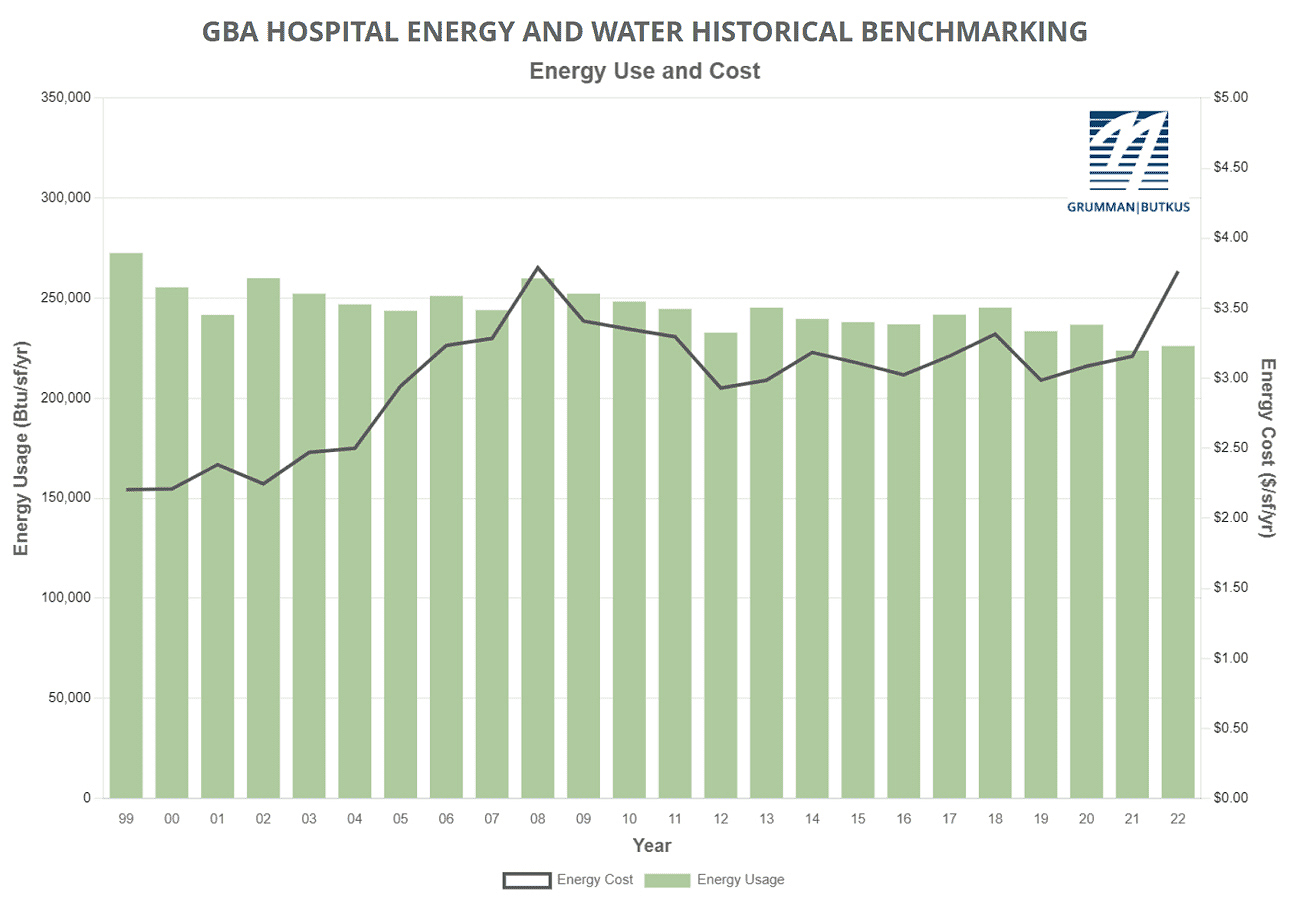
Since GBA initiated the survey nearly 30 years ago, hospitals’ overall fossil fuel use has trended downward, but electricity use isn’t declining as much. The average combined Btu/ft2 (electricity plus gas/steam) for participating facilities was 223,778 in 2021 and 226,081 in 2022, both down from the 236,743 Btu/ft2 reported in CY2020. However, interpretation of year-to-year trends should be tempered by the realization that the respondent pool for 2020-22 would have usage patterns influenced by the COVID-19 pandemic.
Square-foot prices for gas/steam rose ($0.75 in 2021 and $0.98 in 2022, compared with $0.65 in 2020). Square-foot prices for electricity fluctuated ($2.40 in 2021 and $2.78 in 2022, compared with $2.44 in 2020). The overall result is that total reported ft2 costs for energy (gas/steam plus electric) have increased: $3.16 in 2021 and $3.76 in 2022, compared with $3.09 for 2020.
Hospitals’ average carbon footprint has remained fairly steady at 50 to 60 pounds of CO2 equivalent per ft2 per year since GBA began calculating carbon data in 1999. However, Scope 1 and Scope 2 CO2 footprint in 2022 was the lowest it has been since GBA started reporting on carbon emissions (36.96 average CO2 equivalent per ft2 per year). This pattern is likely related to changes in the electric grid, as utilities themselves strive to decarbonize.
Participating facilities displayed a broad range of energy usage patterns. For instance, a few of this year’s survey participants reported fossil fuel consumption of more than 200,000 Btu/sf/year, compared with the general mid-range of facilities (about 130,000 Btu/sf/year) and those that used the least (75,000 Btu/sf/year or less). These variations mean that hospital fossil fuel energy costs may exceed $2.00/sf/year or come in at less than $0.50/sf/year.
Similarly, several hospitals reported consuming more than 40 kWh/sf/year in electrical energy, compared with a mid-range of about 27 kWh/sf/year. A few survey participants squeaked in at less than 20 kWh/sf/year. The wide differences in usage mean that some participants are paying well over $4.00/sf/year for electrical energy, while many are getting by with less than $2.50 and a few with less than $1.75.
“Facilities that have high unit costs for energy should view this as an opportunity,” says GBA-Illinois Chairman Dan Doyle. “For example, a project that would have a five-year payback at an ‘average’ facility may have a payback of just 2.5 or three years at a facility with higher unit costs for energy.”
Hospital water/sewer use has been gradually declining, but was up in both 2021 and 2022, at 42 and 51 gallons per square foot per year, respectively, compared with about 36 gallons per square foot per year in CY2020. The leap between 2021 and 2022 was likely a statistical anomaly caused by different respondent mix between those two years. Costs for water/sewer are undoubtedly rising, however. Respondents reported costs of $0.46/square foot in 2021 and $0.43/square foot in 2022, compared with the $0.27/ft2 that hospitals were spending in 2006, the year GBA began tracking water/sewer use.
“GBA expects the general trend of rising water and sewer costs to continue,” says Doyle. “Price hikes not only reflect increasing costs to extract and treat the water, but also the expense of upgrading or replacing aging infrastructure. In addition, some cash-strapped governmental entities may view water as a revenue sources.”
Since 1995, the GBA survey has provided a free annual benchmarking resource. Hospitals are invited to participate by submitting responses to a short list of questions. Information for this edition was provided by a combined total of 181 hospitals located in Illinois, Wisconsin, New Jersey, Indiana, Michigan, Nevada, and numerous other states coast-to-coast.
Full results and analysis, as well as information about participating in the 2024 survey (2023 data), are available at the firm’s website: grummanbutkus.com/HES.
For additional information, contact Dan Doyle (ddoyle@grummanbutkus.com) or Julie Higginbotham (jhigginbotham@grummanbutkus.com).
Related Stories

Sustainability | Apr 20, 2023
13 trends, technologies, and strategies to expect in 2023
Biophilic design, microgrids, and decarbonization—these are three of the trends, technologies, and strategies IMEG’s market and service leaders believe are poised to have a growing impact on the built environment.

Design Innovation Report | Apr 19, 2023
HDR uses artificial intelligence tools to help design a vital health clinic in India
Architects from HDR worked pro bono with iKure, a technology-centric healthcare provider, to build a healthcare clinic in rural India.

Healthcare Facilities | Apr 17, 2023
UC Irvine takes sustainability to new level with all-electric medical center
The University of California at Irvine (UCI) has a track record for sustainability. Its under-construction UCI Medical Center is designed, positioned, and built to preserve the nearby San Joaquin Marsh Reserve, to reduce the facility’s solar gain by 85%, and to be the first medical center in the country to operate on an all-electric central plant.

Healthcare Facilities | Apr 13, 2023
Healthcare construction costs for 2023
Data from Gordian breaks down the average cost per square foot for a three-story hospital across 10 U.S. cities.

Healthcare Facilities | Apr 13, 2023
Urgent care facilities: Intentional design for mental and behavioral healthcare
The emergency department (ED) is the de-facto front door for behavior health crises, and yet these departments are understaffed, overwhelmed, and ill-equipped to navigate the layered complexities of highly demanding physical and behavioral health needs.

Urban Planning | Apr 12, 2023
Watch: Trends in urban design for 2023, with James Corner Field Operations
Isabel Castilla, a Principal Designer with the landscape architecture firm James Corner Field Operations, discusses recent changes in clients' priorities about urban design, with a focus on her firm's recent projects.

Market Data | Apr 11, 2023
Construction crane count reaches all-time high in Q1 2023
Toronto, Seattle, Los Angeles, and Denver top the list of U.S/Canadian cities with the greatest number of fixed cranes on construction sites, according to Rider Levett Bucknall's RLB Crane Index for North America for Q1 2023.

Contractors | Apr 10, 2023
What makes prefabrication work? Factors every construction project should consider
There are many factors requiring careful consideration when determining whether a project is a good fit for prefabrication. JE Dunn’s Brian Burkett breaks down the most important considerations.

Architects | Apr 6, 2023
New tool from Perkins&Will will make public health data more accessible to designers and architects
Called PRECEDE, the dashboard is an open-source tool developed by Perkins&Will that draws on federal data to identify and assess community health priorities within the U.S. by location. The firm was recently awarded a $30,000 ASID Foundation Grant to enhance the tool.

Sustainability | Apr 4, 2023
NIBS report: Decarbonizing the U.S. building sector will require massive, coordinated effort
Decarbonizing the building sector will require a massive, strategic, and coordinated effort by the public and private sectors, according to a report by the National Institute of Building Sciences (NIBS).


