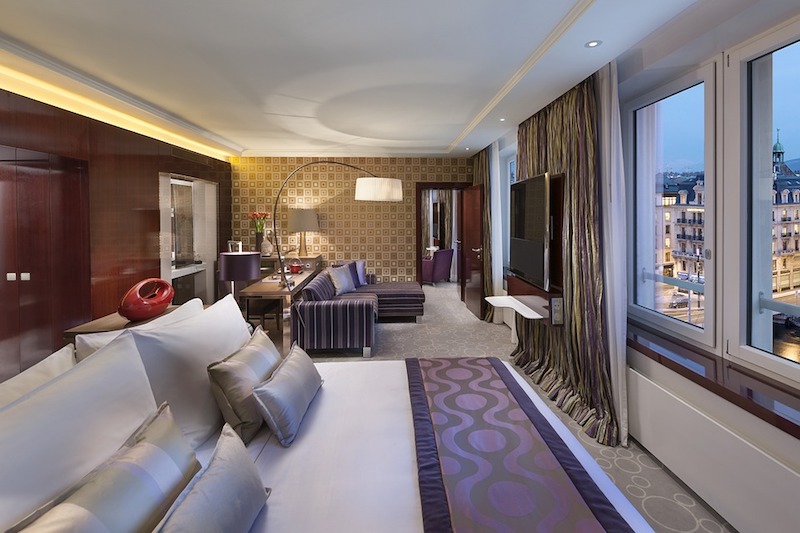
Lodging Econometrics (LE) has released its bi-annual Global Construction Pipeline Trend Report, which compiles the construction pipeline counts for every country and market around the world, states that the total global construction pipeline stands at 12,839 projects/2,158,422 rooms which are at all-time highs. The construction pipeline is up an extraordinary 86% by projects over the cyclical low established in 2011 when global counts were at 6,907 projects/1,257,296 rooms.
There are 5,988 projects/1,133,017 rooms currently under construction worldwide. Projects scheduled to start construction in the next 12 months are at 3,945 projects/570,731 rooms, both counts are at record highs. Projects in the early planning stage stand at 2,906 rooms/454,674 projects, just 134 projects short of the record high established in the fourth quarter of 2017.
The top countries by project count are the United States, which has been rising since 2011, with 5,312 projects/634,501 rooms and China with 2,523 projects/556,645 rooms which has been topping out for the last 4.5 years. The U.S. accounts for 41% of projects in the total global construction pipeline while China accounts for 20%, resulting in 61% of projects in the global pipeline being concentrated in just these two countries. Distantly following are Indonesia with 394 projects/66,759 rooms, Germany with 247 projects/47,155 rooms, and the United Kingdom with 247 projects/36,487 rooms.
The cities with the largest pipeline counts are New York with 169 projects/29,365 rooms, Dubai with 163 projects/47,783 rooms, and Dallas with 156 projects/18,908 rooms. Followed by Houston with 150 projects/16,321 rooms, and Shanghai with 121 projects/24,759 rooms. Of the top 10 cities having pipelines with more than 100 projects, 6 are located in the U.S. while 3 are located in China.
The leading 5 franchise companies in the global construction pipeline by project count are Marriott International with 2,324 projects/391,058 rooms, Hilton Worldwide with 2,202 projects/327,723 rooms, InterContinental Hotels Group (IHG) with 1,653 projects/244,038 rooms, AccorHotels with 809 projects/147,647 rooms, and Choice Hotels with 1024 projects/84,350 rooms. Hyatt, at 212 rooms/45,117 projects, is also significant with their portfolio of large luxury and upper upscale projects as well Best Western with 275 projects/29,243 rooms which are concentrated in the middle three chain scales.
The twenty-five-year explosion of hotel brands now totals 610 globally. Marriott leads with 29 labels, followed by Accor with 25, Hilton with 15, IHG and Hyatt with 12 each, and Choice with 11.
Leading pipeline brands for each of these companies are Marriott’s Fairfield Inn with 345 projects/37,224 rooms, Hilton’s Hampton Inn with 604 projects/77,193 rooms, IHG’s Holiday Inn Express with 713 projects/88,689 rooms, AccorHotels ibis Brands with 358 projects/53,387 rooms, and Choice’s Comfort with 322 projects/26,878 rooms.
As a result of record pipeline totals, new hotel openings continue to hit record levels. In 2020, totals could reach a lofty 3,000 new hotel openings, approximately 1,250 of them being in the U.S.
Related Stories
Senior Living Design | May 9, 2017
Designing for a future of limited mobility
There is an accessibility challenge facing the U.S. An estimated 1 in 5 people will be aged 65 or older by 2040.
Industry Research | May 4, 2017
How your AEC firm can go from the shortlist to winning new business
Here are four key lessons to help you close more business.
Engineers | May 3, 2017
At first buoyed by Trump election, U.S. engineers now less optimistic about markets, new survey shows
The first quarter 2017 (Q1/17) of ACEC’s Engineering Business Index (EBI) dipped slightly (0.5 points) to 66.0.
Market Data | May 2, 2017
Nonresidential Spending loses steam after strong start to year
Spending in the segment totaled $708.6 billion on a seasonally adjusted, annualized basis.
Market Data | May 1, 2017
Nonresidential Fixed Investment surges despite sluggish economic in first quarter
Real gross domestic product (GDP) expanded 0.7 percent on a seasonally adjusted annualized rate during the first three months of the year.
Industry Research | Apr 28, 2017
A/E Industry lacks planning, but still spending large on hiring
The average 200-person A/E Firm is spending $200,000 on hiring, and not budgeting at all.
Market Data | Apr 19, 2017
Architecture Billings Index continues to strengthen
Balanced growth results in billings gains in all regions.
Market Data | Apr 13, 2017
2016’s top 10 states for commercial development
Three new states creep into the top 10 while first and second place remain unchanged.
Market Data | Apr 6, 2017
Architecture marketing: 5 tools to measure success
We’ve identified five architecture marketing tools that will help your firm evaluate if it’s on the track to more leads, higher growth, and broader brand visibility.
Market Data | Apr 3, 2017
Public nonresidential construction spending rebounds; overall spending unchanged in February
The segment totaled $701.9 billion on a seasonally adjusted annualized rate for the month, marking the seventh consecutive month in which nonresidential spending sat above the $700 billion threshold.


