In the third quarter of 2018, analysts at Lodging Econometrics (LE) report that the top five markets with the largest total hotel construction pipelines are: New York City with 170 projects/29,630 rooms; Dallas with 157 projects/18,954 rooms; Houston with 150 projects/16,473 rooms; Los Angeles with 141 projects/24,129 rooms; and Nashville with 115 projects/15,179 rooms.
Projects already under construction and those scheduled to start construction in the next 12 months, combined, have a total of 3,782 projects/213,798 rooms and are at cyclical highs. Markets with the greatest number of projects already in the ground and those scheduled to start construction in the next 12 months are New York with 145 projects/24,675 rooms, Dallas with 112 projects/13,854 rooms, Houston with 103 projects/11,562 rooms, Los Angeles with 92 projects/14,249 rooms, and Nashville with 88 projects/12,322 rooms.
In the third quarter, Los Angeles has the highest number of new projects announced into the pipeline with 22 projects/6,457 rooms. Detroit follows Los Angeles with 18 projects/1,937 rooms, Dallas with 14 projects/1,529 rooms, New York City with 12 projects/1,857 rooms, and then Atlanta with 12 projects/1,354 rooms.
Reflecting the strong cyclical highs in the pipeline, LE’s forecast for new hotel openings will continue to rise in 2018-2020. In 2018, New York City tops the list with 29 new hotels expected to open/5,351 rooms, Dallas with 29 projects/3,187 rooms, Houston with 27 projects/3,259 rooms, Nashville with 22 projects/3,018 rooms, and Los Angeles with 12 projects/2,152 rooms. In the 2019 forecast, New York continues to lead with the highest number of new hotels expected to open with 59 projects/8,964 rooms followed by Houston with 31 projects/3,098 rooms and Dallas with 30 projects/3,379 rooms. In 2020, Dallas is forecast to take the lead for new hotel openings with 41 projects/4,809 rooms expected to open, followed by New York with 36 projects/5,978 rooms, and Los Angeles with 33 projects/4,292 rooms expected to open.
With the exception of New York City and Houston, the other markets mentioned in the opening show that supply growth has begun to surpass demand. The variances in 2018 year-to-date are small but are certain to widen in the next two years, given the strength of these pipeline in the markets.
All in all, 10 of the top 25 markets show supply growth minimally exceeding demand growth in 2018.
Related Stories
Market Data | Mar 19, 2018
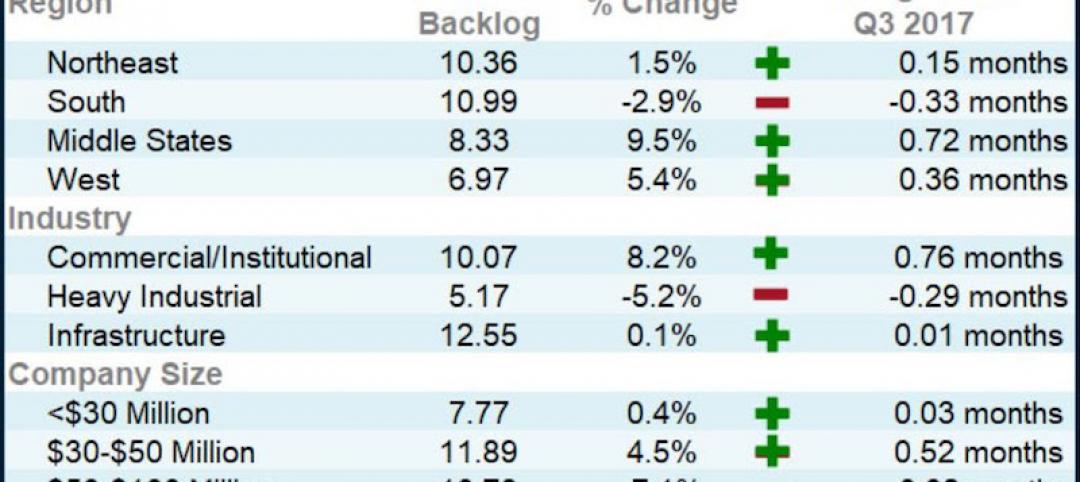
ABC's Construction Backlog Indicator hits a new high: 2018 poised to be a very strong year for construction spending
CBI is up by 1.36 months, or 16.3%, on a year-over-year basis.
Market Data | Mar 15, 2018
ABC: Construction materials prices continue to expand briskly in February
Compared to February 2017, prices are up 5.2%.
Market Data | Mar 14, 2018
AGC: Tariff increases threaten to make many project unaffordable
Construction costs escalated in February, driven by price increases for a wide range of building materials, including steel and aluminum.
Market Data | Mar 12, 2018
Construction employers add 61,000 jobs in February and 254,000 over the year
Hourly earnings rise 3.3% as sector strives to draw in new workers.
Steel Buildings | Mar 9, 2018
New steel and aluminum tariffs will hurt construction firms by raising materials costs; potential trade war will dampen demand, says AGC of America
Independent studies suggest the construction industry could lose nearly 30,000 jobs as a result of administration's new tariffs as many firms will be forced to absorb increased costs.
Market Data | Mar 8, 2018
Prioritizing your marketing initiatives
It’s time to take a comprehensive look at your plans and figure out the best way to get from Point A to Point B.
Market Data | Mar 6, 2018
Persistent workforce shortages challenge commercial construction industry as U.S. building demands continue to grow
To increase jobsite efficiency and improve labor productivity, increasingly more builders are turning to alternative construction solutions.
Market Data | Mar 2, 2018
Nonresidential construction spending dips slightly in January
Private nonresidential construction fell 1.5% for the month, while public sector nonresidential spending increased 1.9%.
Market Data | Feb 27, 2018
AIA small firm report: Half of employees have ownership stake in their firm
The American Institute of Architects has released its first-ever Small Firm Compensation Report.
Market Data | Feb 21, 2018
Strong start for architecture billings in 2018
The American Institute of Architects reported the January 2018 ABI score was 54.7, up from a score of 52.8 in the previous month.


