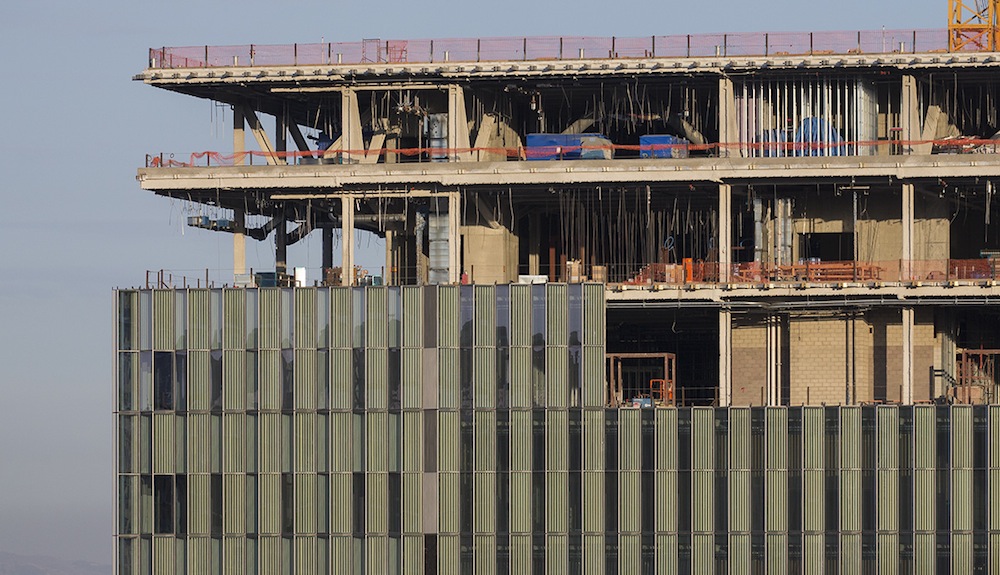
Leopardo released its 2016 Construction Economics Report and Outlook, a guide to help business leaders, healthcare administrators and government decision-makers understand the factors that impact construction costs.
This year’s report shows that 2015 was a turning point for commercial real estate construction, as spending reached the highest level since the Great Recession and even the pace of growth accelerated more than in previous years.
By the end of 2015, total spending on U.S. construction grew 10.5% to $1.1 trillion, the largest year-over-year gain since 2007. The most dynamic growth was in the private sector, where construction spending expanded 12.3%, compared to just 5.6% growth in public-sector projects.
"With a steadily growing economy, low national vacancy rates and historically low interest rates, companies are seeing this period as the right time to expand or relocate their facilities to accommodate growth,” said Jim Leopardo, CEO of Leopardo. “We’re seeing healthy construction volume of nearly every property type, both nationally and in the Chicago area.”
Key findings in the report include:
- Multifamily construction has grown by 29.4% annually since 2011, driven by a movement of renters by choice in urban work-live-play areas. In the same period, single-family home construction increased 14.8% annually.
- Office construction spending grew by 22% in 2014, driven by job growth in the tech sector. This growth spurt is expected to scale back to an average 5.9% annual growth rate through 2019.
- Construction jobs grew 7.8% in the Chicago area, outpacing the national average of 4.2% in 2015. In 2014, Chicago’s 3.2% construction job growth lagged the national average of 5.7%.
Related Stories
Market Data | Jun 26, 2018
Yardi Matrix examines potential regional multifamily supply overload
Outsize development activity in some major metros could increase vacancy rates and stagnate rent growth.
Market Data | Jun 22, 2018
Multifamily market remains healthy – Can it be sustained?
New report says strong economic fundamentals outweigh headwinds.
Market Data | Jun 21, 2018
Architecture firm billings strengthen in May
Architecture Billings Index enters eighth straight month of solid growth.
Market Data | Jun 20, 2018
7% year-over-year growth in the global construction pipeline
There are 5,952 projects/1,115,288 rooms under construction, up 8% by projects YOY.
Market Data | Jun 19, 2018
ABC’s Construction Backlog Indicator remains elevated in first quarter of 2018
The CBI shows highlights by region, industry, and company size.
Market Data | Jun 19, 2018
America’s housing market still falls short of providing affordable shelter to many
The latest report from the Joint Center for Housing Studies laments the paucity of subsidies to relieve cost burdens of ownership and renting.
Market Data | Jun 18, 2018
AI is the path to maximum profitability for retail and FMCG firms
Leading retailers including Amazon, Alibaba, Lowe’s and Tesco are developing their own AI solutions for automation, analytics and robotics use cases.
Market Data | Jun 12, 2018
Yardi Matrix report details industrial sector's strength
E-commerce and biopharmaceutical companies seeking space stoke record performances across key indicators.
Market Data | Jun 8, 2018
Dodge Momentum Index inches up in May
May’s gain was the result of a 4.7% increase by the commercial component of the Momentum Index.
Market Data | Jun 4, 2018
Nonresidential construction remains unchanged in April
Private sector spending increased 0.8% on a monthly basis and is up 5.3% from a year ago.


