

Over the first half of 2017, the national median rent fluctuated, but it ended up exactly where it began: $1,016 for a one-bedroom. Prices fell from January to March, bottoming out at $1,003 before creeping back up in the spring. In all, the national median rent always stayed within 1.3% of its starting value.
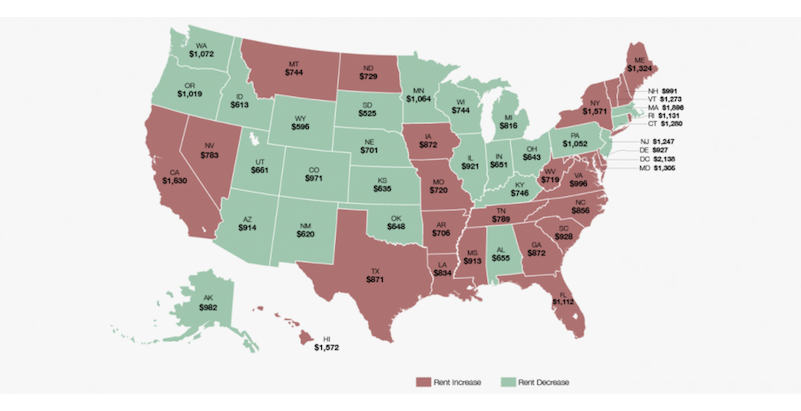
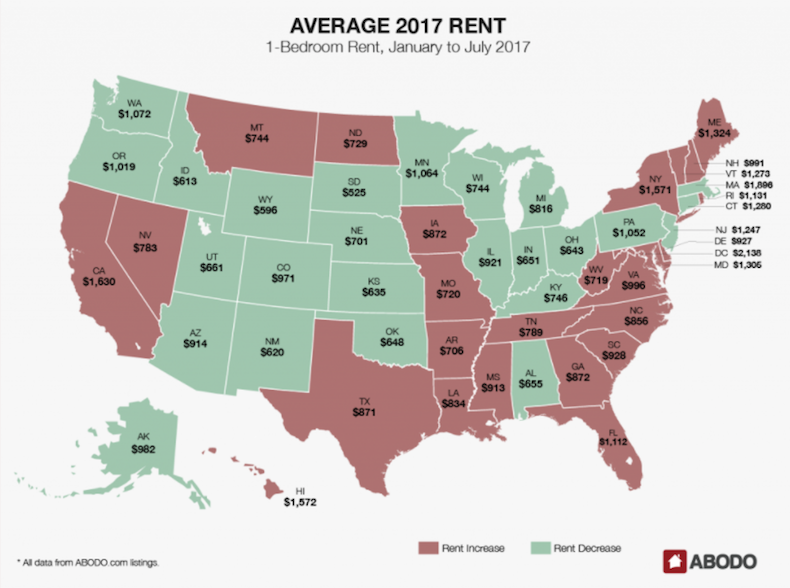
A slight majority of states (26, plus the District of Columbia) saw rental increases over the first six months of 2017, with the largest average percent changes coming in South Carolina (7.3%), Maine (7.3%), Vermont (7.2%), and Rhode Island (7.0%), Abodo's Midyear Rent Report reports. The greatest average decreases were significantly lower: Utah (-4.4%), Oklahoma (-3.3%), Pennsylvania (-2.7%), Connecticut (-2.3%).
The majority of states, 31, saw average changes in rent price of 1.3% or lower.
The states with the highest average rents will surprise no one. The District of Columbia had the highest average rent from January to July, with one-bedrooms going for $2,138 per month. Massachusetts ($1,896), California ($1,630), Hawaii ($1,572), and New York ($1,571) followed. The four states with the lowest average rents were all in the West or Southwest: South Dakota ($525), Wyoming ($596), Idaho ($613), and New Mexico ($620).
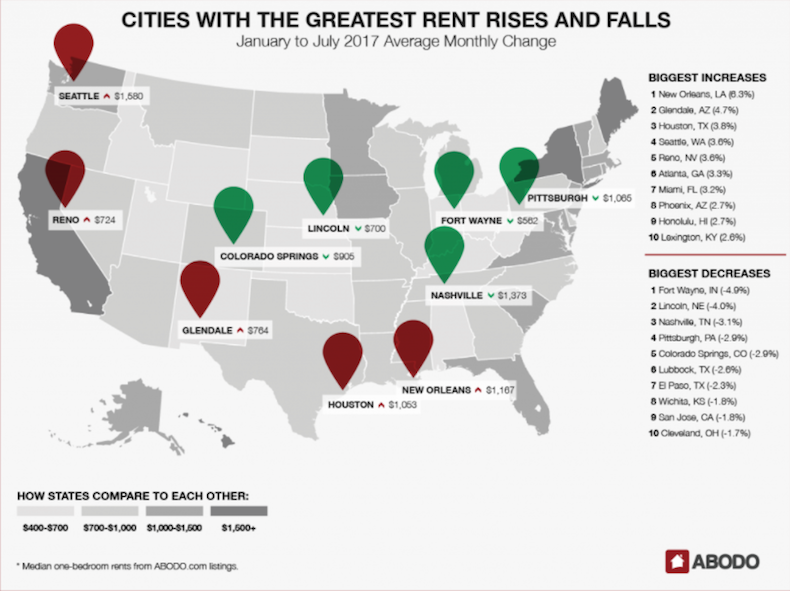
In December, our annual rent report noted that many of the cities with the fastest-growing rents were between the coasts. That trend continued in the first half of 2017: Eight of the top 10 cities for rental hikes were in the South or Southwest. New Orleans led the way, with an average monthly change of 6.3% and an average rent of $1,167. Glendale, Ariz. (4.7%, $764), and Houston (3.8%; $1,053), followed closely behind, with Reno, N.V., Atlanta, Miami, Phoenix, and Lexington, Ky., also making appearances.
The only geographic outliers were Seattle, which saw rents rise an average of 3.6% over the first half of the year, and Honolulu (2.6%).
The biggest drops in rent also continued to veer west and south. Fort Wayne, Ind., saw the largest rent drop, with an average decline of 4.9% per month and an average rent of $562. Lincoln, Neb., where the average rent is $700, experienced an average decline of 4% per month. And booming Nashville, Tenn., where the average one-bedroom rents for $1,373, saw an average drop of 3.1% per month.
From June to July, the biggest rental hike was in Newark, N.J., which saw its one-bedroom rent increase 10.2% to $1,120. Philadelphia (8.5%; $1,305) and Honolulu (8%; $1,654) rounded out the top three. In June, Reno saw its rent rise 6.7% to $832, and New Orleans jumped 5.8% to $1,397, continuing the months-long upward trend that landed them on the list for highest year-to-date change.
For the second month in a row, Buffalo, N.Y., and St. Paul, Minn., experienced the largest drops in rent in the country. This month, the order was reversed: St. Paul leads the way, with a 7.4% decrease to $1,233. Buffalo saw its rent drop 7.2% to $939. Glendale, which over the first six months of 2017 had the second-highest average monthly increase in rent, saw its median one-bedroom decrease 6.8% over the month of June, bottoming out at $833.
The cities with the highest rents are largely unchanged since last month’s report. San Francisco rents dropped $40 to $3,240, but that wasn’t enough to bump the city from its spot atop the rankings. As usual, New York City ($2,913) and San Jose ($2,378) rounded out the top three. The only real movement in the list of the country’s highest rents was near the bottom: Chicago ($1,861) superseded Miami ($1,855) for eighth place.
Nationally, rental prices were relatively stable through the first six months of 2017. Rent is rising in just over half of the nation’s states, and certain cities are seeing sustained increases in rent month to month. Cities where rent was already high—New York, D.C., Los Angeles—are still high, but the most notable rental increases are in growing markets in the South and Southwest, a continuation of a trend we noticed in our 2016 Annual Report.
In the next six months, rental prices in those markets will be a good barometer for how well new development is keeping up with what appears to be continued—and rising—demand for rentals.
Related Stories

MFPRO+ News | Jul 22, 2024
6 multifamily WAFX 2024 Prize winners
Over 30 projects tackling global challenges such as climate change, public health, and social inequality have been named winners of the World Architecture Festival’s WAFX Awards.

Office Buildings | Jul 22, 2024
U.S. commercial foreclosures increased 48% in June from last year
The commercial building sector continues to be under financial pressure as foreclosures nationwide increased 48% in June compared to June 2023, according to ATTOM, a real estate data analysis firm.

Codes and Standards | Jul 22, 2024
Tennessee developers can now hire their own building safety inspectors
A new law in Tennessee allows developers to hire their own building inspectors to check for environmental, safety, and construction violations. The law is intended to streamline the building process, particularly in rapidly growing communities.

Codes and Standards | Jul 22, 2024
New FEMA rules include climate change impacts
FEMA’s new rules governing rebuilding after disasters will take into account the impacts of climate change on future flood risk. For decades, the agency has followed a 100-year floodplain standard—an area that has a 1% chance of flooding in a given year.

Construction Costs | Jul 18, 2024
Data center construction costs for 2024
Gordian’s data features more than 100 building models, including computer data centers. These localized models allow architects, engineers, and other preconstruction professionals to quickly and accurately create conceptual estimates for future builds. This table shows a five-year view of costs per square foot for one-story computer data centers.

Sustainability | Jul 18, 2024
Grimshaw launches free online tool to help accelerate decarbonization of buildings
Minoro, an online platform to help accelerate the decarbonization of buildings, was recently launched by architecture firm Grimshaw, in collaboration with more than 20 supporting organizations including World Business Council for Sustainable Development (WBCSD), RIBA, Architecture 2030, the World Green Building Council (WorldGBC) and several national Green Building Councils from across the globe.

University Buildings | Jul 17, 2024
University of Louisville Student Success Building will be new heart of engineering program
A new Student Success Building will serve as the heart of the newly designed University of Louisville’s J.B. Speed School of Engineering. The 115,000-sf structure will greatly increase lab space and consolidate student services to one location.

Healthcare Facilities | Jul 16, 2024
Watch on-demand: Key Trends in the Healthcare Facilities Market for 2024-2025
Join the Building Design+Construction editorial team for this on-demand webinar on key trends, innovations, and opportunities in the $65 billion U.S. healthcare buildings market. A panel of healthcare design and construction experts present their latest projects, trends, innovations, opportunities, and data/research on key healthcare facilities sub-sectors. A 2024-2025 U.S. healthcare facilities market outlook is also presented.

K-12 Schools | Jul 15, 2024
A Cleveland suburb opens a $31.7 million new middle school and renovated high school
Accommodating 1,283 students in grades 6-12, the Warrensville, Ohio school complex features flexible learning environments and offers programs ranging from culinary arts and firefighting training to e-sports.

MFPRO+ News | Jul 15, 2024
More permits for ADUs than single-family homes issued in San Diego
Popularity of granny flats growing in California


