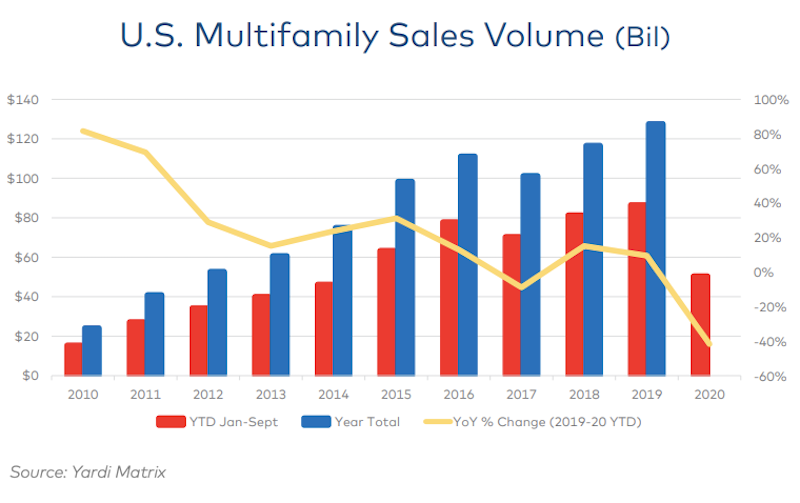
Yardi® Matrix analyzed multifamily transaction activity for its final special report of 2020, and found that property sales are down sharply – though impact varies regionally - as a result of the pandemic.
Through three quarters in 2020, $50.6 billion of multifamily property sales were completed in the U.S., down 41.7% from $86.5 billion through the same period a year ago, according to the report. There’s little hope full-year volume will get close to 2019’s record high of $127.8 billion. Gateway and coastal metros have generally seen a larger decline in deal flow than secondary and tertiary markets in the Sun Belt and Southwest.
“Much of the change could be described as a ‘filtering’ effect: investors moving from urban cores to inner-ring suburbs, from primary to secondary metros and from secondary to tertiary metros. This phenomenon results from several factors, including owners putting fewer properties on the market, disagreement between buyers and sellers about prices, the composition of buyers, and the competition for assets,” states the report.
Like many industries, multifamily sales saw a stronger performance in Q3 than during earlier in the year. Capital availability is relatively strong due to lack of better alternatives, optimism about future demand for housing, and the stability afforded by the government-sponsored enterprises Fannie Mae and Freddie Mac.
Gain all the insight in this special multifamily transaction report from industry data leader Yardi Matrix.
Yardi Matrix offers the industry’s most comprehensive market intelligence tool for investment professionals, equity investors, lenders and property managers who underwrite and manage investments in commercial real estate. Yardi Matrix covers multifamily, industrial, office and self storage property types. Email matrix@yardi.com, call 480-663-1149 or visit yardimatrix.com to learn more.
Related Stories
Market Data | Apr 20, 2021
Demand for design services continues to rapidly escalate
AIA’s ABI score for March rose to 55.6 compared to 53.3 in February.
Market Data | Apr 16, 2021
Construction employment in March trails March 2020 mark in 35 states
Nonresidential projects lag despite hot homebuilding market.
Market Data | Apr 13, 2021
ABC’s Construction Backlog slips in March; Contractor optimism continues to improve
The Construction Backlog Indicator fell to 7.8 months in March.
Market Data | Apr 9, 2021
Record jump in materials prices and supply chain distributions threaten construction firms' ability to complete vital nonresidential projects
A government index that measures the selling price for goods used construction jumped 3.5% from February to March.
Contractors | Apr 9, 2021
Construction bidding activity ticks up in February
The Blue Book Network's Velocity Index measures month-to-month changes in bidding activity among construction firms across five building sectors and in all 50 states.
Industry Research | Apr 9, 2021
BD+C exclusive research: What building owners want from AEC firms
BD+C’s first-ever owners’ survey finds them focused on improving buildings’ performance for higher investment returns.
Market Data | Apr 7, 2021
Construction employment drops in 236 metro areas between February 2020 and February 2021
Houston-The Woodlands-Sugar Land and Odessa, Texas have worst 12-month employment losses.
Market Data | Apr 2, 2021
Nonresidential construction spending down 1.3% in February, says ABC
On a monthly basis, spending was down in 13 of 16 nonresidential subcategories.
Market Data | Apr 1, 2021
Construction spending slips in February
Shrinking demand, soaring costs, and supply delays threaten project completion dates and finances.
Market Data | Mar 26, 2021
Construction employment in February trails pre-pandemic level in 44 states
Soaring costs, supply-chain problems jeopardize future jobs.


