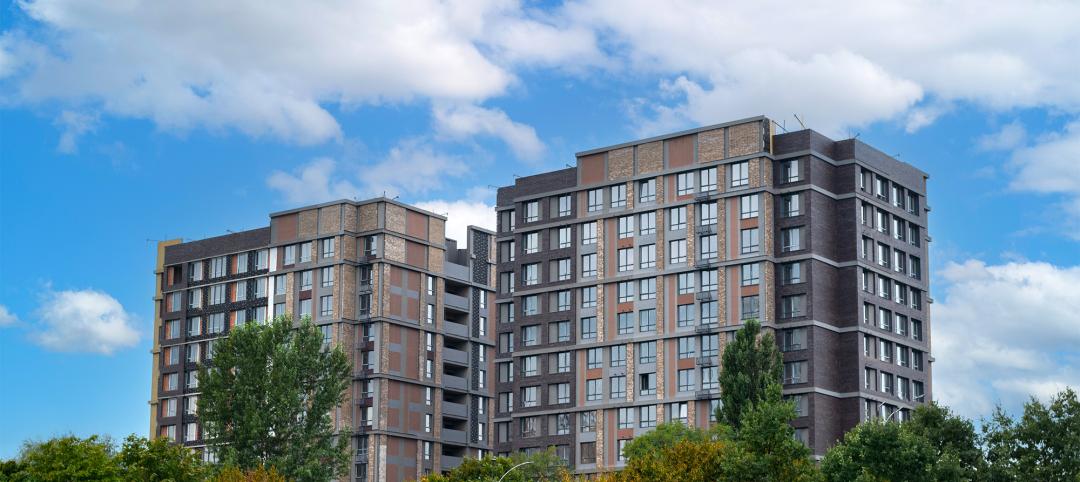
Transwestern’s second-quarter national office market report highlights continued improvement in the sector thanks in large part to a strong jobs market with remarkably low overall unemployment of 3.9%, and a 1.6% annual growth rate in office-using employment.
For the second quarter, office absorption totaled 18.8 million square feet, vacancy remained stable at 9.6%, and average asking rents increased by 3.4% annually to $25.71 per square foot.
“As more individuals return to the workforce citing real wage growth, further tightening in the core metrics is anticipated through the balance of the year,” said Stuart Showers, Research Director in Houston.
The rise in rental rates marks the 21st consecutive quarterly increase, with Minneapolis; Charlotte, North Carolina; Columbus, Ohio; San Antonio and Austin, Texas leading the nation in year-over-year rent growth. San Francisco edged out New York for the highest asking rates in the country at $74.40 per square foot.
“Despite only 4 million square feet currently under construction in San Francisco versus more than 14 million square feet in New York, San Francisco is increasing total inventory by a higher percentage, which could drive asking rates even higher as new product comes online,” said Ryan Tharp, Research Director in Dallas. “Additionally, existing tariffs on steel and aluminum are likely to drive up construction costs, and landlords may need to bump up rental rates to compensate.”
Worth noting is that while national quarterly absorption remained positive, the pace of absorption is slowing as quarterly totals are approximately 20% below three- and five-year quarterly averages. Overall, 34 of the 49 Transwestern reporting markets registered positive absorption in the second quarter, underscoring the strength of the sector.
Download the national office market report at: http://twurls.com/2q18-us-offi
Related Stories
Construction Costs | May 16, 2024
New download: BD+C's May 2024 Market Intelligence Report
Building Design+Construction's monthly Market Intelligence Report offers a snapshot of the health of the U.S. building construction industry, including the commercial, multifamily, institutional, and industrial building sectors. This report tracks the latest metrics related to construction spending, demand for design services, contractor backlogs, and material price trends.
Contractors | May 15, 2024
The average U.S. contractor has 8.4 months worth of construction work in the pipeline, as of April 2024
Associated Builders and Contractors reported that its Construction Backlog Indicator increased to 8.4 months in April, according to an ABC member survey conducted April 22 to May 6. The reading is down 0.5 months from April 2023, but expanded 0.2 months from the prior month.
Healthcare Facilities | May 6, 2024
Hospital construction costs for 2024
Data from Gordian breaks down the average cost per square foot for a three-story hospital across 10 U.S. cities.
Contractors | May 1, 2024
Nonresidential construction spending rises 0.2% in March 2024 to $1.19 trillion
National nonresidential construction spending increased 0.2% in March, according to an Associated Builders and Contractors analysis of data published today by the U.S. Census Bureau. On a seasonally adjusted annualized basis, nonresidential spending totaled $1.19 trillion.
AEC Tech | Apr 30, 2024
Lack of organizational readiness is biggest hurdle to artificial intelligence adoption
Managers of companies in the industrial sector, including construction, have bought the hype of artificial intelligence (AI) as a transformative technology, but their organizations are not ready to realize its promise, according to research from IFS, a global cloud enterprise software company. An IFS survey of 1,700 senior decision-makers found that 84% of executives anticipate massive organizational benefits from AI.
Hotel Facilities | Apr 24, 2024
The U.S. hotel construction market sees record highs in the first quarter of 2024
As seen in the Q1 2024 U.S. Hotel Construction Pipeline Trend Report from Lodging Econometrics (LE), at the end of the first quarter, there are 6,065 projects with 702,990 rooms in the pipeline. This new all-time high represents a 9% year-over-year (YOY) increase in projects and a 7% YOY increase in rooms compared to last year.
Construction Costs | Apr 18, 2024
New download: BD+C's April 2024 Market Intelligence Report
Building Design+Construction's monthly Market Intelligence Report offers a snapshot of the health of the U.S. building construction industry, including the commercial, multifamily, institutional, and industrial building sectors. This report tracks the latest metrics related to construction spending, demand for design services, contractor backlogs, and material price trends.
Market Data | Apr 16, 2024
The average U.S. contractor has 8.2 months worth of construction work in the pipeline, as of March 2024
Associated Builders and Contractors reported today that its Construction Backlog Indicator increased to 8.2 months in March from 8.1 months in February, according to an ABC member survey conducted March 20 to April 3. The reading is down 0.5 months from March 2023.
K-12 Schools | Apr 10, 2024
Surprise, surprise: Students excel in modernized K-12 school buildings
Too many of the nation’s school districts are having to make it work with less-than-ideal educational facilities. But at what cost to student performance and staff satisfaction?
Multifamily Housing | Apr 9, 2024
March reports record gains in multifamily rent growth in 20 months
Asking rents for multifamily units increased $8 during the month to $1,721; year-over-year growth grew 30 basis points to 0.9 percent—a normal seasonal growth pattern according to Yardi Matrix.


