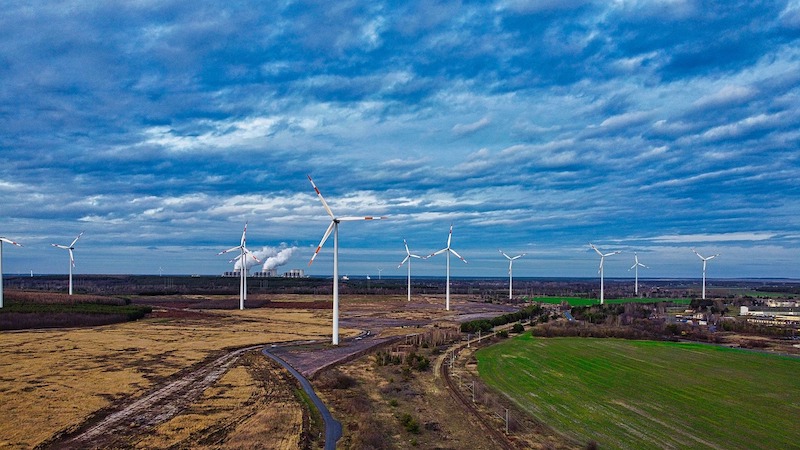
A new report from Navigant Research analyzes the global wind power market to assess current and future development cycles and projections for new installed wind capacity. The report provides global market forecasts, segmented by region, through 2028.
Global wind industry installations were flat from 2017 to 2018, but behind the flat figures are profound shifts throughout global wind power markets. Some mature markets are facing flat or declining growth due to adjustments to more competitive policy environments and reductions or eliminations of subsidies. However, these changes are being offset by increasing wind power development in countries that were not previously wind power markets. This new capacity represents a market worth more than $92 billion in 2019 and more than $1 trillion over the forecast decade.
“Growth in wind capacity is led by countries in Asia Pacific and non-traditional markets in Europe, Latin America, and the Middle East & Africa,” says Jesse Broehl, senior research analyst with Navigant Research. “Wind power is being developed not only in a greater variety of countries but also increasingly in offshore as well as onshore.”
According to the report, global offshore wind development is expected to experience a 16% compound annual growth rate over a 10-year forecast period. China, Taiwan, and Europe are the leading markets, with the US soon to join when the first large-scale offshore wind plants are commissioned in coming years along the northeast coast of the country. The report also examines the annual installed capacity of top global wind turbine original equipment manufacturers (OEMs) and related market share and ranking. The most recent year-end 2018 data shows Denmark-based Vestas retaking the global total annual capacity lead and three other Western OEMs falling in the global total annual rankings. The turbine OEM market dynamics show consolidation throughout the sector, with top OEMs commanding larger market shares.
The report, Global Wind Energy Overview, analyzes the global wind power market to assess current and future development cycles and projections for new installed wind capacity. The study provides an analysis of the market issues related to wind development, including drivers and barriers such as power contract auction rates, volume, and related policy and market environments. Global market forecasts, segmented by region, extend through 2028. The report also summarizes the key industry players related to wind power development. An Executive Summary of the report is available for free download on the Navigant Research website.
Related Stories
MFPRO+ Research | Oct 15, 2024
Multifamily rents drop in September 2024
The average multifamily rent fell by $3 in September to $1,750, while year-over-year growth was unchanged at 0.9 percent.
Contractors | Oct 1, 2024
Nonresidential construction spending rises slightly in August 2024
National nonresidential construction spending increased 0.1% in August, according to an Associated Builders and Contractors analysis of data published today by the U.S. Census Bureau. On a seasonally adjusted annualized basis, nonresidential spending totaled $1.22 trillion.
The Changing Built Environment | Sep 23, 2024
Half-century real estate data shows top cities for multifamily housing, self-storage, and more
Research platform StorageCafe has conducted an analysis of U.S. real estate activity from 1980 to 2023, focusing on six major sectors: single-family, multifamily, industrial, office, retail, and self-storage.
Student Housing | Sep 17, 2024
Student housing market stays strong in summer 2024
As the summer season winds down, student housing performance remains strong. Preleasing for Yardi 200 schools rose to 89.2% in July 2024, falling just slightly behind the same period last year.
MFPRO+ Research | Sep 11, 2024
Multifamily rents fall for first time in 6 months
Ending its six-month streak of growth, the average advertised multifamily rent fell by $1 in August 2024 to $1,741.
Contractors | Sep 10, 2024
The average U.S. contractor has 8.2 months worth of construction work in the pipeline, as of August 2024
Associated Builders and Contractors reported today that its Construction Backlog Indicator fell to 8.2 months in August, according to an ABC member survey conducted Aug. 20 to Sept. 5. The reading is down 1.0 months from August 2023.
Construction Costs | Sep 2, 2024
Construction material decreases level out, but some increases are expected to continue for the balance Q3 2024
The Q3 2024 Quarterly Construction Insights Report from Gordian examines the numerous variables that influence material pricing, including geography, global events and commodity volatility. Gordian and subject matter experts examine fluctuations in costs, their likely causes, and offer predictions about where pricing is likely to go from here. Here is a sampling of the report’s contents.
Contractors | Aug 21, 2024
The average U.S. contractor has 8.4 months worth of construction work in the pipeline, as of July 2024
Associated Builders and Contractors reported today that its Construction Backlog Indicator held steady at 8.4 months in July, according to an ABC member survey conducted July 22 to Aug. 6. The reading is down 0.9 months from July 2023.
MFPRO+ Research | Aug 9, 2024
Apartment completions to surpass 500,000 for first time ever
While the U.S. continues to maintain a steady pace of delivering new apartments, this year will be one for the record books.
Contractors | Aug 1, 2024
Nonresidential construction spending decreased 0.2% in June
National nonresidential construction spending declined 0.2% in June, according to an Associated Builders and Contractors analysis of data published today by the U.S. Census Bureau. On a seasonally adjusted annualized basis, nonresidential spending totaled $1.21 trillion. Nonresidential construction has expanded 5.3% from a year ago.


