Access to wireless Internet connection is practically a must these days. That’s why the iconic CCTV building in China even went through a year-long retrofit to improve Wi-Fi signals for building occupants.
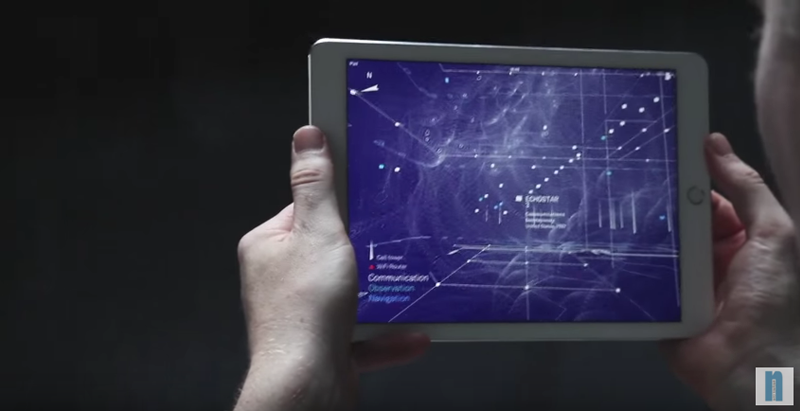
One application is stepping into the direction of Wi-Fi signal visualization. Called Architecture of Radio, the app has been described by Teche Blog as “one of the coolest apps [we've] come across in recent time.”
Users are able to see a 360-degree illustration of Wi-Fi signals around them based on data from seven million cell towers, 19 million Wi-Fi routers, and hundreds of satellites.
The application was created by software developer Richard Vijgen, and can plot not just wireless, but also wired network signals. The catch: signals are not shown in real time, but from a database. In other words, the app “gives you a pretty good idea of the density of digital signals around you, but it won’t tell you where to move the couch to get a better WiFi signal,” the app description says.
"The purpose of this app is to make the invisible visible so we can look at it, think about it, and discuss it," Vijgen told Teche Blog.
Released on the Apple App Store on Nov. 17, the application currently has 2.5 stars from 116 ratings.
“Definitely a cool concept with a relatively intuitive interface. The main problem is in all the unidentified cell towers,” writes reviewer Mistergizmo. “Since the app works off a database rather than real-time signals, this should be fixable, which I'm sure it will be, at which point I'll increase the number of stars. But in the meantime, it's certainly a fun app.”
Related Stories
| Nov 16, 2010
Calculating office building performance? Yep, there’s an app for that
123 Zero build is a free tool for calculating the performance of a market-ready carbon-neutral office building design. The app estimates the discounted payback for constructing a zero emissions office building in any U.S. location, including the investment needed for photovoltaics to offset annual carbon emissions, payback calculations, estimated first costs for a highly energy efficient building, photovoltaic costs, discount rates, and user-specified fuel escalation rates.
| Nov 9, 2010
12 incredible objects being made with 3D printers today
BD+C has reported on how 3D printers are attracting the attention of AEC firms. Now you can see how other creative types are utilizing this fascinating printing technology. Among the printed items: King Tut’s remains, designer shoes, and the world’s smallest Rubik’s Cube.
| Nov 5, 2010
New Millennium’s Gary Heasley on BIM, LEED, and the nonresidential market
Gary Heasley, president of New Millennium Building Systems, Fort Wayne, Ind., and EVP of its parent company, Steel Dynamics, Inc., tells BD+C’s Robert Cassidy about the Steel Joist Manufacturer’s westward expansion, its push to create BIM tools for its products, LEED, and the outlook for the nonresidential construction market.
| Nov 2, 2010
Energy Analysis No Longer a Luxury
Back in the halcyon days of 2006, energy analysis of building design and performance was a luxury. Sure, many forward-thinking AEC firms ran their designs through services such as Autodesk’s Green Building Studio and IES’s Virtual Environment, and some facility managers used Honeywell’s Energy Manager and other monitoring software. Today, however, knowing exactly how much energy your building will produce and use is survival of the fittest as energy costs and green design requirements demand precision.
| Oct 13, 2010
Test run on the HP Z200 SFF Good Value in a Small Package
Contributing Editor Jeff Yoders tests a new small-form factor, workstation-class desktop in Hewlett-Packard’s line that combines performance of its minitower machine with a smaller chassis and a lower price.
| Oct 13, 2010
Prefab Trailblazer
The $137 million, 12-story, 500,000-sf Miami Valley Hospital cardiac center, Dayton, Ohio, is the first major hospital project in the U.S. to have made extensive use of prefabricated components in its design and construction.


