

Staying ahead of cost trends can feel like an uphill battle. Market volatility, geographical variations and the lag between project initiation to build introduces unpredictability in the total cost of construction projects. Working in uncertainty can lead to budget overruns, delays and decreased profitability, making it challenging to keep up. But what if there was a solution that could turn these challenges into opportunities for success? To ensure success in any project, you need the ability to anticipate changes and make informed decisions.
Turn data into actionable intelligence with Gordian’s new Data Insights – Cost Trends Dashboard, powered by RSMeans™ Data. Unveiled at their 2024 RSMeans™ Data Webinar, Gordian’s latest tool empowers organizations to gain more real time insight into shifting cost trends across construction categories and geographies – all within a single, visually digestible dashboard.
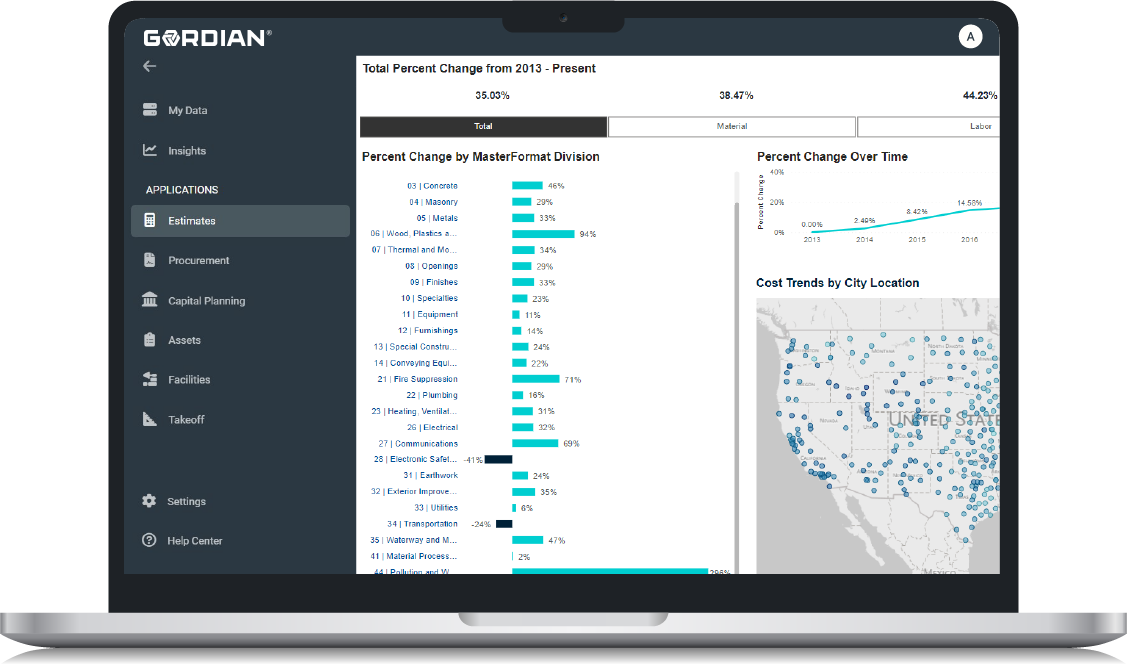
Gordian’s Data Insights – Cost Trends gives you a comprehensive view into historical construction cost trends, providing visibility into current cost movements. This allows you to strategically evaluate and adjust your estimates and budgets based on how prices have fluctuated in past, similar market conditions. By using a systematic, automated method of accessing cost trends, you have up-to-date insights at your fingertips, saving time, eliminating guesswork and enhancing decision-making.
What Can You Expect From Data Insights – Cost Trends?
- Go from guesswork to an objective approach
Leveraging past experiences for project budgeting and estimating is beneficial, but manual methods are error-prone and inefficient. A systematic, objective approach allows you to identify hidden patterns, understand trends over time and adjust estimates to align with current market conditions.
- Granular insights across construction categories
Leveraging RSMeans™ Data, the Dashboard provides an aggregated, historical view of cost data in an intuitive design, giving you the ability to compare multiple levels of detail based on empirical figures. From overall cost trends to drilling down by cost components, including labor, material, equipment or at the task division level.
Historical cost trends across geographies
Whether you are looking for local market insights or researching unfamiliar geographical markets, the Dashboard provides location-specific cost trends for nearly 1,000 North American markets so you can compare costs and benchmark across various locations. Uncover hidden patterns in historical cost data, providing a clear picture of trends over time, or pinpoint current market conditions in nearby areas to determine where you can find cost savings on materials and project costs.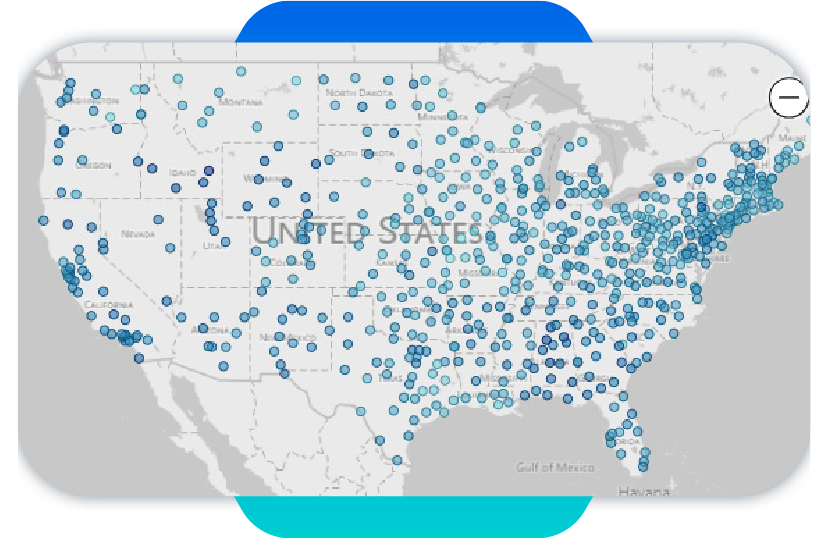
Access local market insights or research unfamiliar geographical markets.
- Communicate data in a way everyone can understand
Complex data insights are made easily digestible through clear visualizations in an intuitive interface. Empower non-technical users to explore and discover actionable market intelligences to anticipate cost changes, adjust budgets and make informed decisions when prioritizing and planning construction projects.
Get Ready to Empower Your Organization With Actionable Intelligence
Gordian’s Data Insights – Cost Trends Dashboard provides more than just data. It offers a flexible, intuitive and interactive experience, enabling more effective planning, budgeting and estimating in construction projects. It’s the tool that empowers estimators, facility owners, facility managers and contractors alike to take control of projects.
Staying ahead of cost trends is no longer a luxury, it’s a necessity. Learn how you can start making informed, proactive decisions to ensure your organizations success with Gordian’s new Data Insights – Cost Trends Dashboard.
Company Information:
Name: Gordian
Website: rsmeans.com
Contact Information: Sales Inquiries – 888-675-3601
Related Stories

AEC Tech | Nov 12, 2020
The Weekly show: Nvidia's Omniverse, AI for construction scheduling, COVID-19 signage
BD+C editors speak with experts from ALICE Technologies, Build Group, Hastings Architecture, Nvidia, and Woods Bagot on the November 12 episode of "The Weekly." The episode is available for viewing on demand.

Smart Buildings | Oct 26, 2020
World’s first smart building assessment and rating program released
The SPIRE Smart Building Program will help building owners and operators make better investment decisions, improve tenant satisfaction, and increase asset value.

Big Data | Feb 10, 2020
Building sensors: A digital crystal ball
Sensors capture data that provides developers, owners, and AEC firms with actionable insights on building performance.

Big Data | Dec 4, 2019
AEC data's coming out party
AEC firms are finally putting to use project information they’ve been storing in their computers for years.

Sponsored | Big Data | Jul 16, 2019
Solving the Construction Estimating Puzzle: How to Estimate Thoroughly and Accurately for Every Project


Building Technology | Dec 18, 2018
Data and analytics are becoming essential for EC firms competing to rebuild America’s infrastructure
A new paper from Deloitte Consulting advises companies to revise their strategies with an eye toward leveraging advanced technologies.

Big Data | Aug 31, 2018
The building data analytics revolution in three acts
Increased transparency of operational building data is impacting accountability.

Big Data | Aug 23, 2018
Data driven design: The benefits of building energy modeling
As technology advances, Building Energy Modeling (BEM) is becoming an even more powerful tool for making informed design decisions. This is the first post in our series examining the benefits of BEM in balancing occupant comfort and design features with energy efficiency.


