

Staying ahead of cost trends can feel like an uphill battle. Market volatility, geographical variations and the lag between project initiation to build introduces unpredictability in the total cost of construction projects. Working in uncertainty can lead to budget overruns, delays and decreased profitability, making it challenging to keep up. But what if there was a solution that could turn these challenges into opportunities for success? To ensure success in any project, you need the ability to anticipate changes and make informed decisions.
Turn data into actionable intelligence with Gordian’s new Data Insights – Cost Trends Dashboard, powered by RSMeans™ Data. Unveiled at their 2024 RSMeans™ Data Webinar, Gordian’s latest tool empowers organizations to gain more real time insight into shifting cost trends across construction categories and geographies – all within a single, visually digestible dashboard.
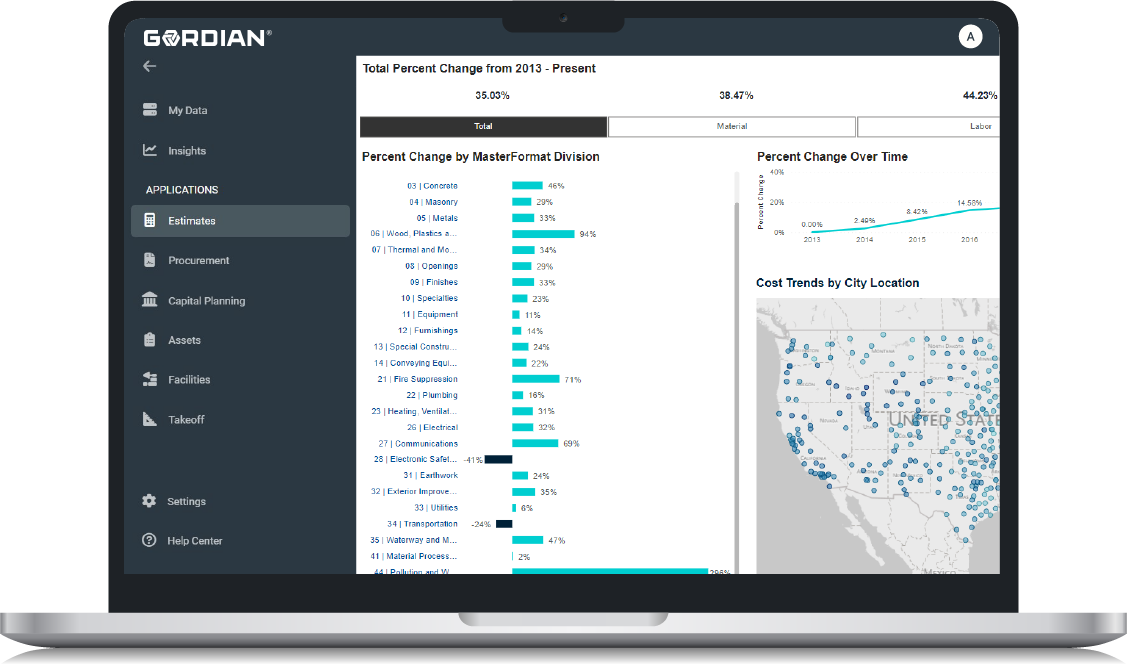
Gordian’s Data Insights – Cost Trends gives you a comprehensive view into historical construction cost trends, providing visibility into current cost movements. This allows you to strategically evaluate and adjust your estimates and budgets based on how prices have fluctuated in past, similar market conditions. By using a systematic, automated method of accessing cost trends, you have up-to-date insights at your fingertips, saving time, eliminating guesswork and enhancing decision-making.
What Can You Expect From Data Insights – Cost Trends?
- Go from guesswork to an objective approach
Leveraging past experiences for project budgeting and estimating is beneficial, but manual methods are error-prone and inefficient. A systematic, objective approach allows you to identify hidden patterns, understand trends over time and adjust estimates to align with current market conditions.
- Granular insights across construction categories
Leveraging RSMeans™ Data, the Dashboard provides an aggregated, historical view of cost data in an intuitive design, giving you the ability to compare multiple levels of detail based on empirical figures. From overall cost trends to drilling down by cost components, including labor, material, equipment or at the task division level.
Historical cost trends across geographies
Whether you are looking for local market insights or researching unfamiliar geographical markets, the Dashboard provides location-specific cost trends for nearly 1,000 North American markets so you can compare costs and benchmark across various locations. Uncover hidden patterns in historical cost data, providing a clear picture of trends over time, or pinpoint current market conditions in nearby areas to determine where you can find cost savings on materials and project costs.
Access local market insights or research unfamiliar geographical markets.
- Communicate data in a way everyone can understand
Complex data insights are made easily digestible through clear visualizations in an intuitive interface. Empower non-technical users to explore and discover actionable market intelligences to anticipate cost changes, adjust budgets and make informed decisions when prioritizing and planning construction projects.
Get Ready to Empower Your Organization With Actionable Intelligence
Gordian’s Data Insights – Cost Trends Dashboard provides more than just data. It offers a flexible, intuitive and interactive experience, enabling more effective planning, budgeting and estimating in construction projects. It’s the tool that empowers estimators, facility owners, facility managers and contractors alike to take control of projects.
Staying ahead of cost trends is no longer a luxury, it’s a necessity. Learn how you can start making informed, proactive decisions to ensure your organizations success with Gordian’s new Data Insights – Cost Trends Dashboard.
Company Information:
Name: Gordian
Website: rsmeans.com
Contact Information: Sales Inquiries – 888-675-3601
Related Stories

BIM and Information Technology | Jul 2, 2018
Data, Dynamo, and design iteration
We’re well into the digital era of architecture which favors processes that have a better innovation cycle.

Accelerate Live! | Jun 24, 2018
Watch all 19 Accelerate Live! talks on demand
BD+C’s second annual Accelerate Live! AEC innovation conference (May 10, 2018, Chicago) featured talks on AI for construction scheduling, regenerative design, the micro-buildings movement, post-occupancy evaluation, predictive visual data analytics, digital fabrication, and more. Take in all 19 talks on demand.

Market Data | Jun 18, 2018
AI is the path to maximum profitability for retail and FMCG firms
Leading retailers including Amazon, Alibaba, Lowe’s and Tesco are developing their own AI solutions for automation, analytics and robotics use cases.
| Jun 11, 2018
Accelerate Live! talk: ‘AEC can has Blockchains?’
In this 15-minute talk at BD+C’s Accelerate Live! conference (May 10, 2018, Chicago), HOK’s Greg Schleusner explores how the AEC industry could adapt the best ideas from other industries (banking, manufacturing, tech) to modernize inefficient design and construction processes.
| May 30, 2018
Accelerate Live! talk: Seven technologies that restore glory to the master builder
In this 15-minute talk at BD+C’s Accelerate Live! conference (May 10, 2018, Chicago), AEC technophile Rohit Arora outlines emerging innovations that are poised to transform how we design and build structures in the near future.

Big Data | Jan 5, 2018
In the age of data-driven design, has POE’s time finally come?
At a time when research- and data-based methods are playing a larger role in architecture, there remains a surprisingly scant amount of post-occupancy research. But that’s starting to change.
Green | Dec 22, 2017
Green builders can use ‘big data’ to make design decisions
More and more, green project teams are relying on publicly available “external datasets” to prioritize sustainable design decisions, says sustainability consultant Adele Houghton.
Reconstruction & Renovation | Dec 21, 2017
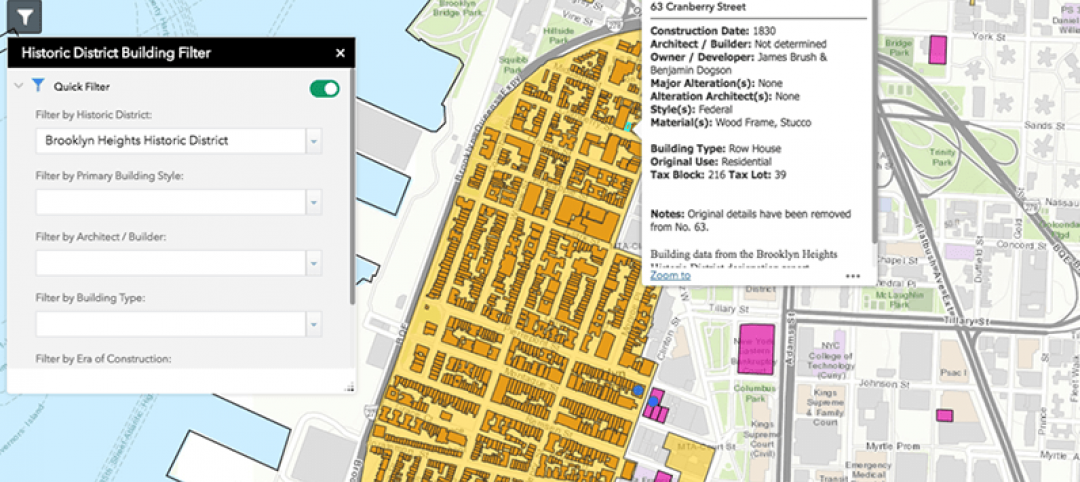
Interactive map includes detailed information on historic New York City buildings
The New York City Landmarks Preservation Commission launched a new, enhanced version of its interactive map, Discover NYC Landmarks.

AEC Tech | Oct 6, 2017
How professional bias can sabotage industry transformation
Professional bias can take the form of change-resistant thinking that can keep transformational or innovative ambitions at bay. Tech consultant Nate Miller presents three kinds of bias that often emerge when a professional is confronted with new technology.
AEC Tech | Aug 24, 2017
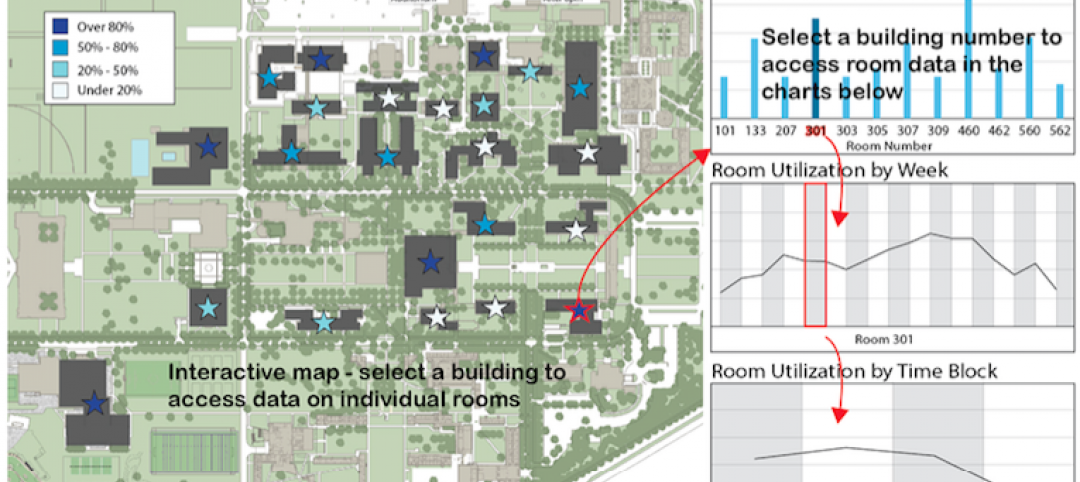
Big Data helps space optimization, but barriers remain
Space optimization is a big issue on many university campuses, as schools face increasing financial constraints, writes Hanbury’s Jimmy Stevens.


