


According to the common measure of housing affordability, a household is considered "cost-burdened" when housing expenses consume over 30% of occupant's total gross income. Those that spend more than 50% of their income on monthly housing costs are classified as "severely" cost-burdened.
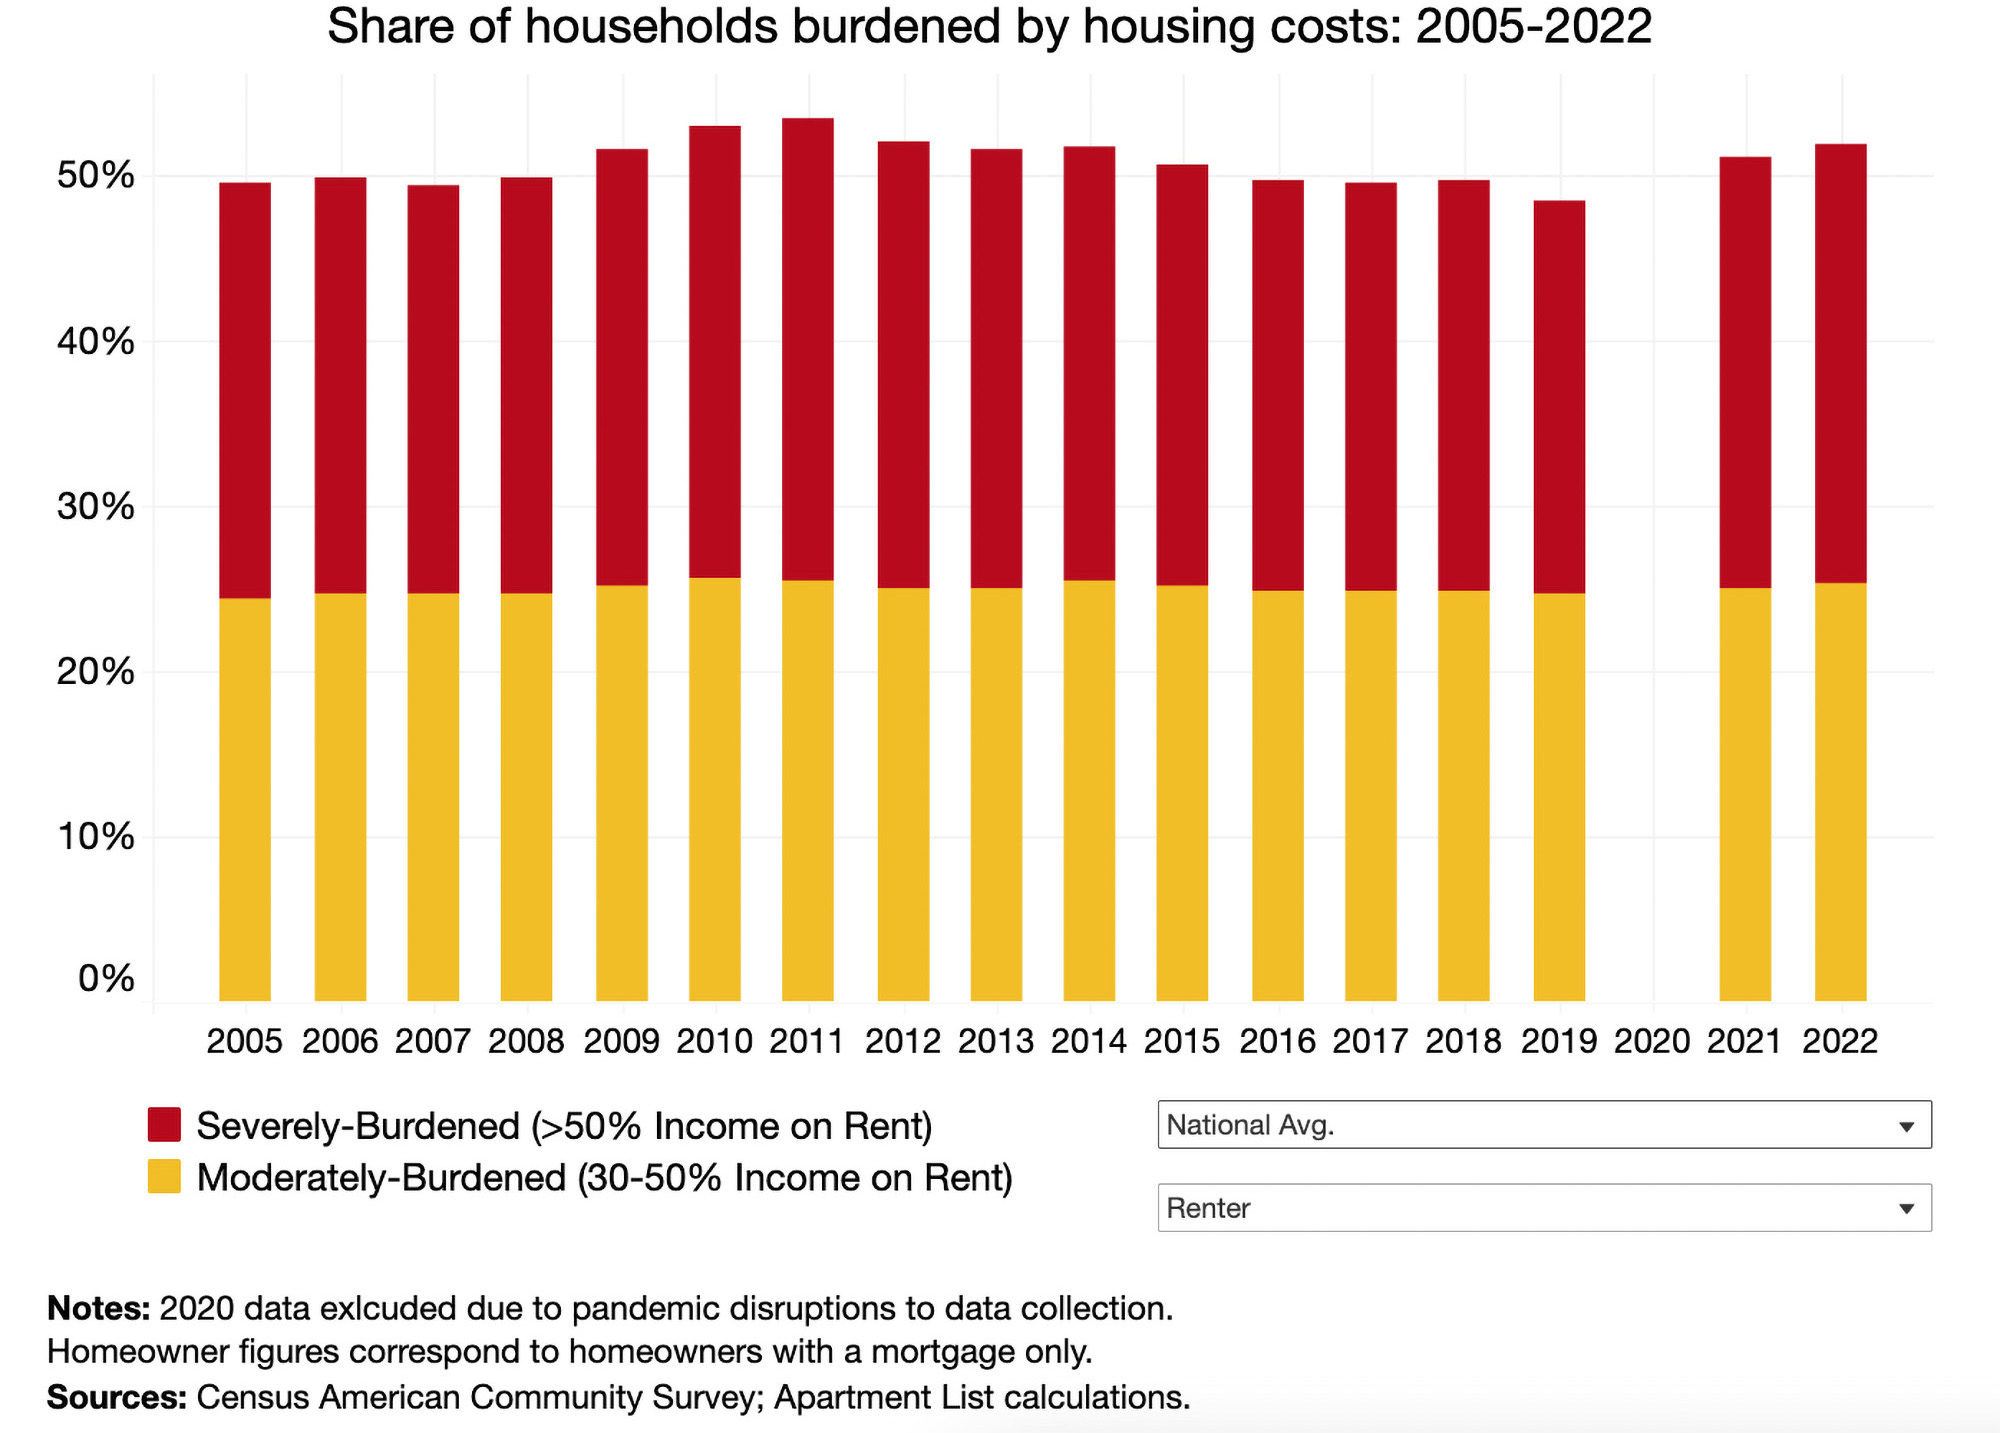
The most recent data derived from the 2022 Census American Community Survey reveals that the proportion of American renters facing housing cost burdens has reached its highest point since 2012, undoing the progress made in the ten years leading up to the pandemic. The majority of this increase can be attributed to a surge in severely burdened households—those expending more than half of their earnings on rent.
The latest report by Apartment List explores the cost burden rate and what it says about the state of housing affordability in the U.S. Here are some of their takeaways:
1. The pandemic burdened nearly 2 million renters in the last three years
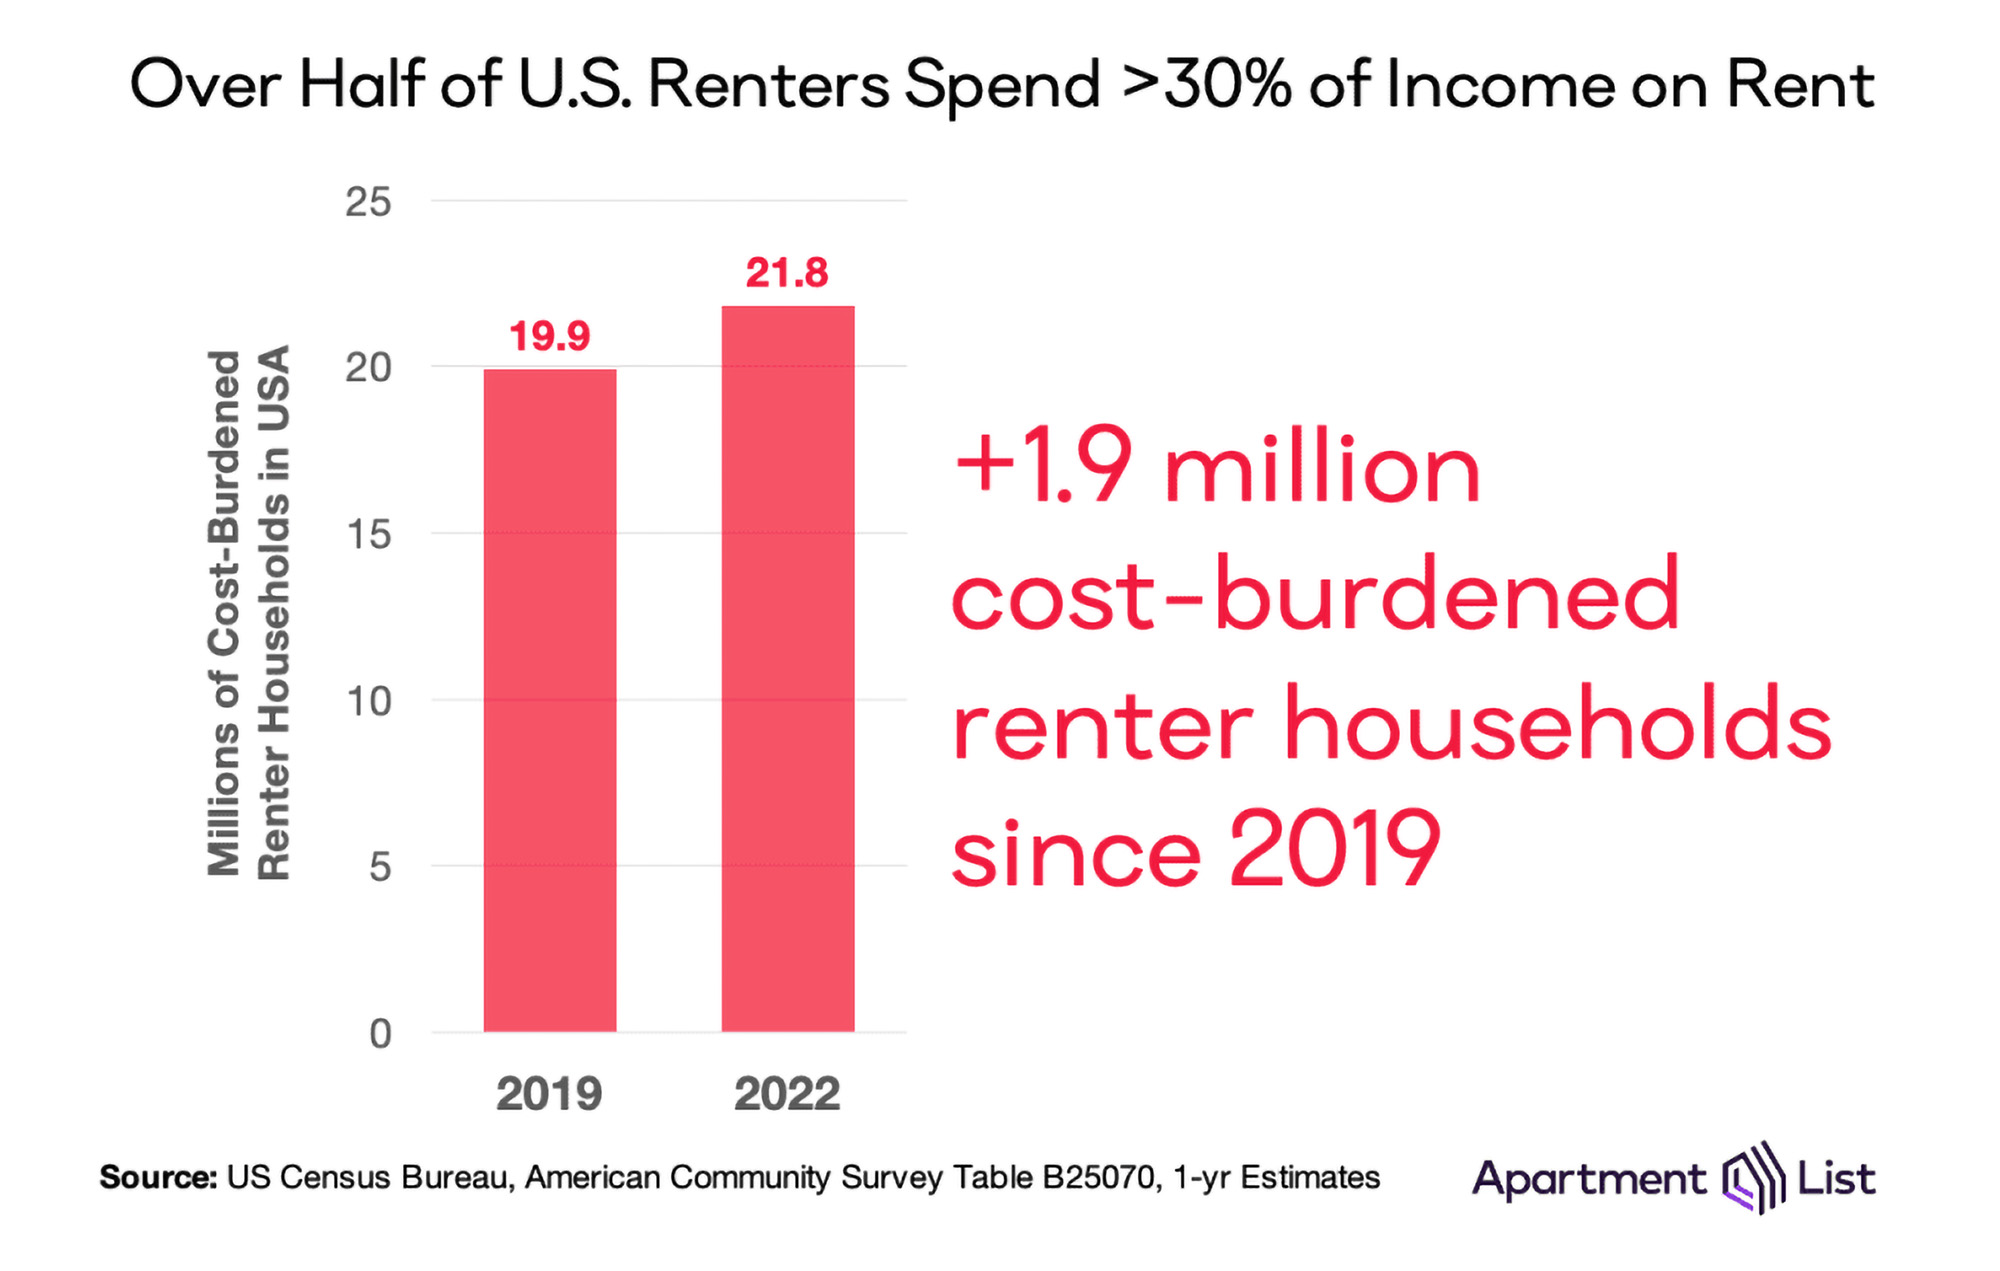
The number of cost-burdened renter households have been decreasing steadily since 2011. In a five-year span alone, the number of homes fell by 826,000 between 2014 and 2019. By 2019, just under 20 million renter households were considered cost-burdened.
In 2022, however, the number of cost-burdened renter households has increased by 1.9 million—making the total 21.8 million—and the number of non-burdened households fell by 957,000.
2. Severely-burdened households make up 27% of those affected
Renter households that spend more that 50% of their income on housing costs are considered severely-burdened. In the past three years, the share of these households among the total of those burdened increased by 3% to 26.7 percent.
Though the cost burden rate is much lower for those who own homes, it has also been rising in recent years. In 2022, the percentage of homeowners that are cost-burdened jumped to 27.9 percent, up from 26.6% in 2019.
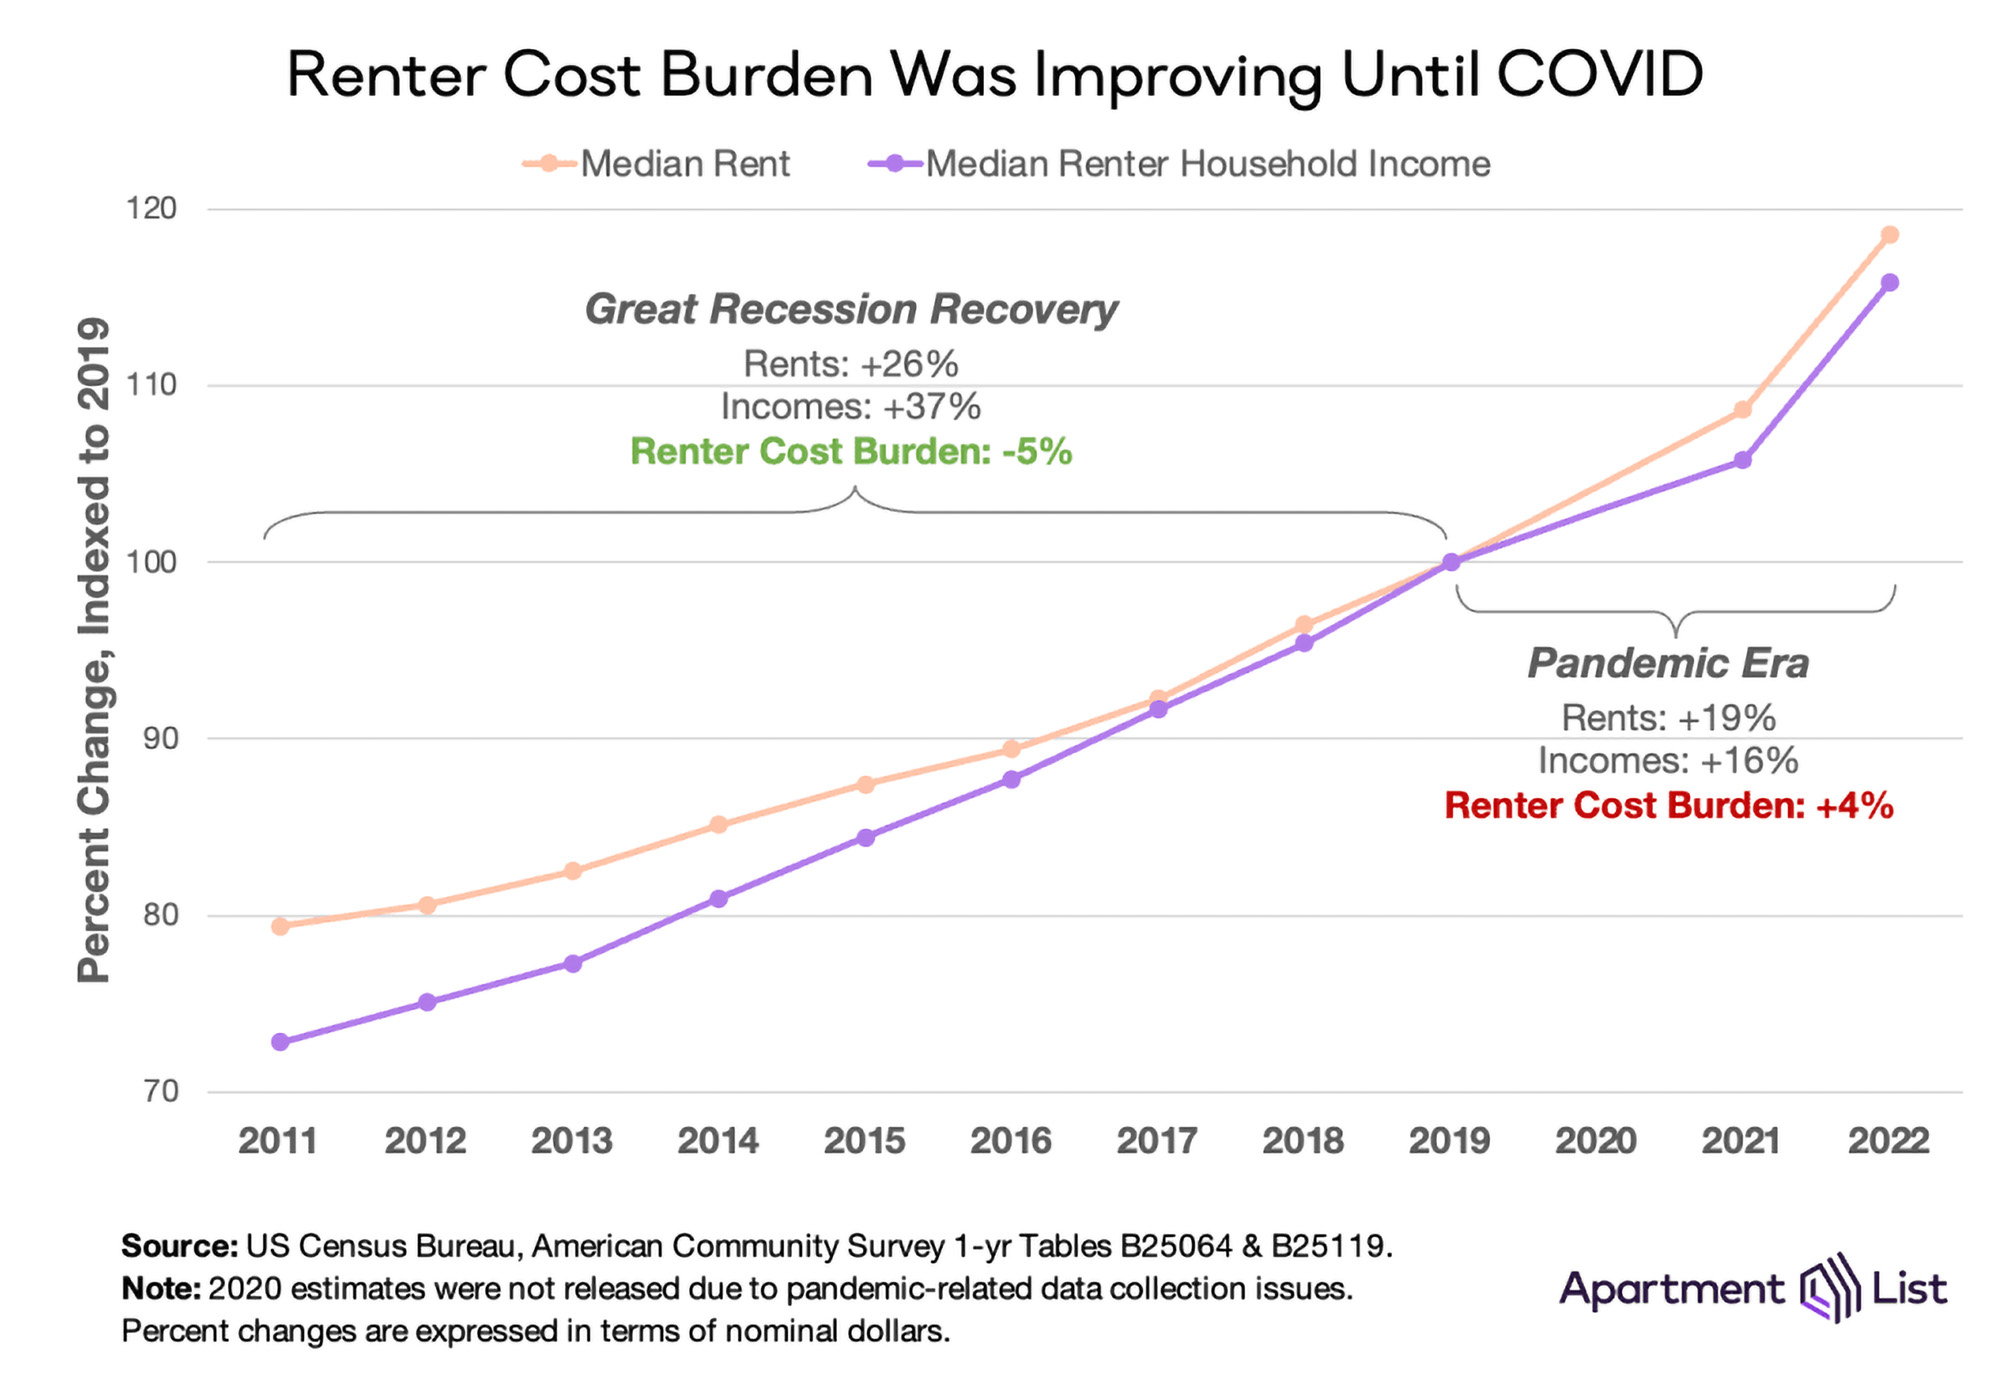
3. The cost burden is driven by rent prices rising faster than household incomes
After the Great Recession, renter cost burden improved gradually for several years. While the median rent rose 26 percent, the median renter household income increased 37 percent in the same eight years.
Since 2019, renter cost burden has increased 4% and median rent jumped up 19 percent, while renter income rose only 16 percent. According to the Apartment List analysis, 74 of the 100 largest U.S. metros have experienced rent prices growing faster than renter income. Since 2019, the cost burden has worsened in nearly all (94%) of the top metros.
Future outlook from Apartment List
"Preliminary data from the Bureau of Labor Statistics shows that incomes in the second quarter of 2023 are up 5.7% year-over-year (1.7% after adjusting for inflation). And while these statistics are not available for renters specifically, other breakdowns show that recent wage growth is higher for lower-earners and non-white workers, who are both more likely to rent.
However, rent growth may also continue on an upward trajectory. For more than half of all renter households, monthly rent payments are eating up a large enough share of their income to put financial stability at risk. And more than one-in-four renter households spend more than half of their income on rent—a level which can often necessitate extreme measures such as overcrowding and cutting back on spending on other basic needs. Thankfully, policymakers have demonstrated an increased focus on this issue in recent years, but solutions are still urgently needed."
To read the full report, visit Apartment List
Related Stories
Market Data | Aug 18, 2023
Construction soldiers on, despite rising materials and labor costs
Quarterly analyses from Skanska, Mortenson, and Gordian show nonresidential building still subject to materials and labor volatility, and regional disparities.
Apartments | Aug 14, 2023
Yardi Matrix updates near-term multifamily supply forecast
The multifamily housing supply could increase by up to nearly 7% by the end of 2023, states the latest Multifamily Supply Forecast from Yardi Matrix.

Hotel Facilities | Aug 2, 2023
Top 5 markets for hotel construction
According to the United States Construction Pipeline Trend Report by Lodging Econometrics (LE) for Q2 2023, the five markets with the largest hotel construction pipelines are Dallas with a record-high 184 projects/21,501 rooms, Atlanta with 141 projects/17,993 rooms, Phoenix with 119 projects/16,107 rooms, Nashville with 116 projects/15,346 rooms, and Los Angeles with 112 projects/17,797 rooms.

Market Data | Aug 1, 2023
Nonresidential construction spending increases slightly in June
National nonresidential construction spending increased 0.1% in June, according to an Associated Builders and Contractors analysis of data published today by the U.S. Census Bureau. Spending is up 18% over the past 12 months. On a seasonally adjusted annualized basis, nonresidential spending totaled $1.07 trillion in June.

Hotel Facilities | Jul 27, 2023
U.S. hotel construction pipeline remains steady with 5,572 projects in the works
The hotel construction pipeline grew incrementally in Q2 2023 as developers and franchise companies push through short-term challenges while envisioning long-term prospects, according to Lodging Econometrics.

Hotel Facilities | Jul 26, 2023
Hospitality building construction costs for 2023
Data from Gordian breaks down the average cost per square foot for 15-story hotels, restaurants, fast food restaurants, and movie theaters across 10 U.S. cities: Boston, Chicago, Las Vegas, Los Angeles, Miami, New Orleans, New York, Phoenix, Seattle, and Washington, D.C.

Market Data | Jul 24, 2023
Leading economists call for 2% increase in building construction spending in 2024
Following a 19.7% surge in spending for commercial, institutional, and industrial buildings in 2023, leading construction industry economists expect spending growth to come back to earth in 2024, according to the July 2023 AIA Consensus Construction Forecast Panel.

Contractors | Jul 13, 2023
Construction input prices remain unchanged in June, inflation slowing
Construction input prices remained unchanged in June compared to the previous month, according to an Associated Builders and Contractors analysis of U.S. Bureau of Labor Statistics Producer Price Index data released today. Nonresidential construction input prices were also unchanged for the month.

Contractors | Jul 11, 2023
The average U.S. contractor has 8.9 months worth of construction work in the pipeline, as of June 2023
Associated Builders and Contractors reported that its Construction Backlog Indicator remained unchanged at 8.9 months in June 2023, according to an ABC member survey conducted June 20 to July 5. The reading is unchanged from June 2022.

Market Data | Jul 5, 2023
Nonresidential construction spending decreased in May, its first drop in nearly a year
National nonresidential construction spending decreased 0.2% in May, according to an Associated Builders and Contractors analysis of data published today by the U.S. Census Bureau. On a seasonally adjusted annualized basis, nonresidential spending totaled $1.06 trillion.


