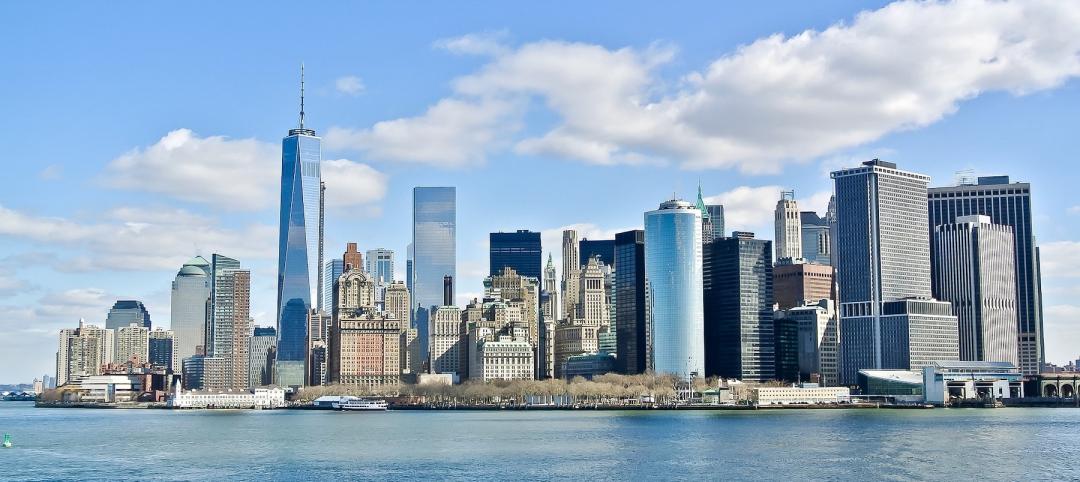
In the recent U.S. Construction Pipeline Trend Report released by Lodging Econometrics (LE), at the close the fourth quarter of 2020 and after more than 6 quarters since leading all U.S. markets in the number of pipeline projects, New York City has regained top billing again with 150 projects/25,640 rooms. Other U.S. markets that follow are Los Angeles with 148 projects/24,808 rooms; Dallas with 147 projects/17,756 rooms; Atlanta with 140 projects/19,863 rooms, recording a record-high number of rooms; and Orlando with 112 projects/19,764 rooms, a record-high pipeline project count for the market.
New York City has the greatest number of projects under construction with 108 projects/19,439 rooms and also the highest number of construction starts in the fourth quarter with 14 projects/2,617 rooms. Following New York City with the highest number of projects under construction is Atlanta with 46 projects/6,728 rooms, and then Los Angeles with 40 projects/7,131 rooms; Dallas with 39 projects/4,656 rooms; and Austin with 33 projects/4,850 rooms.
Despite the impact COVID-19 has had on hotel development, there are four markets in the U.S. that announced more than 10 new construction projects in Q4 ’20. Those markets include Miami with 18 projects accounting for 2,756 rooms, Orlando with 18 projects/4,806 rooms, New York with 17 projects/2,700 rooms, and Atlanta with 11 projects/1,843 rooms.
LE has also seen an increase in announced renovation and brand conversion activity throughout the last few quarters. At year-end 2020, there were 1,308 projects/210,124 rooms in the U.S. undergoing a renovation or conversion. Of the 1,308 renovation and conversion projects, 625 of those are in the top 50 markets. There are nine markets in the U.S. that currently have more than 20 renovation and conversion projects underway. That is led by Los Angeles with 28 projects, followed by Phoenix, Washington DC, Houston, Atlanta, Dallas, Chicago, New York, and Norfolk.
The top 50 markets saw 399 hotels/52,581 rooms open in 2020. LE is forecasting these same 50 markets to open another 509 projects/66,475 rooms in 2021, and 575 projects/71,025 rooms in 2022.
Related Stories
Market Data | Jan 6, 2022
A new survey offers a snapshot of New York’s construction market
Anchin’s poll of 20 AEC clients finds a “growing optimism,” but also multiple pressure points.
Market Data | Jan 3, 2022
Construction spending in November increases from October and year ago
Construction spending in November totaled $1.63 trillion at a seasonally adjusted annual rate.
Market Data | Dec 22, 2021
Two out of three metro areas add construction jobs from November 2020 to November 2021
Construction employment increased in 237 or 66% of 358 metro areas over the last 12 months.
Market Data | Dec 17, 2021
Construction jobs exceed pre-pandemic level in 18 states and D.C.
Firms struggle to find qualified workers to keep up with demand.
Market Data | Dec 15, 2021
Widespread steep increases in materials costs in November outrun prices for construction projects
Construction officials say efforts to address supply chain challenges have been insufficient.
Market Data | Dec 15, 2021
Demand for design services continues to grow
Changing conditions could be on the horizon.
Market Data | Dec 5, 2021
Construction adds 31,000 jobs in November
Gains were in all segments, but the industry will need even more workers as demand accelerates.
Market Data | Dec 5, 2021
Construction spending rebounds in October
Growth in most public and private nonresidential types is offsetting the decline in residential work.
Market Data | Dec 5, 2021
Nonresidential construction spending increases nearly 1% in October
Spending was up on a monthly basis in 13 of the 16 nonresidential subcategories.
Market Data | Nov 30, 2021
Two-thirds of metro areas add construction jobs from October 2020 to October 2021
The pandemic and supply chain woes may limit gains.


