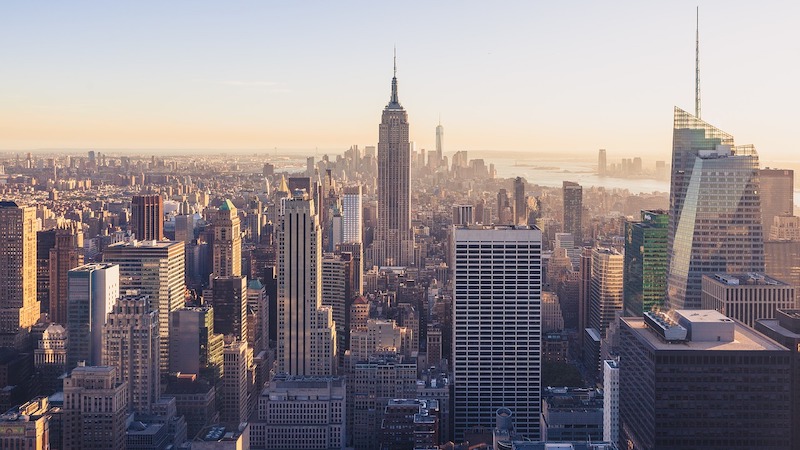
In the recent U.S. Construction Pipeline Trend Report released by Lodging Econometrics (LE), at the close the fourth quarter of 2020 and after more than 6 quarters since leading all U.S. markets in the number of pipeline projects, New York City has regained top billing again with 150 projects/25,640 rooms. Other U.S. markets that follow are Los Angeles with 148 projects/24,808 rooms; Dallas with 147 projects/17,756 rooms; Atlanta with 140 projects/19,863 rooms, recording a record-high number of rooms; and Orlando with 112 projects/19,764 rooms, a record-high pipeline project count for the market.
New York City has the greatest number of projects under construction with 108 projects/19,439 rooms and also the highest number of construction starts in the fourth quarter with 14 projects/2,617 rooms. Following New York City with the highest number of projects under construction is Atlanta with 46 projects/6,728 rooms, and then Los Angeles with 40 projects/7,131 rooms; Dallas with 39 projects/4,656 rooms; and Austin with 33 projects/4,850 rooms.
Despite the impact COVID-19 has had on hotel development, there are four markets in the U.S. that announced more than 10 new construction projects in Q4 ’20. Those markets include Miami with 18 projects accounting for 2,756 rooms, Orlando with 18 projects/4,806 rooms, New York with 17 projects/2,700 rooms, and Atlanta with 11 projects/1,843 rooms.
LE has also seen an increase in announced renovation and brand conversion activity throughout the last few quarters. At year-end 2020, there were 1,308 projects/210,124 rooms in the U.S. undergoing a renovation or conversion. Of the 1,308 renovation and conversion projects, 625 of those are in the top 50 markets. There are nine markets in the U.S. that currently have more than 20 renovation and conversion projects underway. That is led by Los Angeles with 28 projects, followed by Phoenix, Washington DC, Houston, Atlanta, Dallas, Chicago, New York, and Norfolk.
The top 50 markets saw 399 hotels/52,581 rooms open in 2020. LE is forecasting these same 50 markets to open another 509 projects/66,475 rooms in 2021, and 575 projects/71,025 rooms in 2022.
Related Stories
Market Data | Aug 13, 2018
First Half 2018 commercial and multifamily construction starts show mixed performance across top metropolitan areas
Gains reported in five of the top ten markets.
Market Data | Aug 10, 2018
Construction material prices inch down in July
Nonresidential construction input prices increased fell 0.3% in July but are up 9.6% year over year.
Market Data | Aug 9, 2018
Projections reveal nonresidential construction spending to grow
AIA releases latest Consensus Construction Forecast.
Market Data | Aug 7, 2018
New supply's impact illustrated in Yardi Matrix national self storage report for July
The metro with the most units under construction and planned as a percent of existing inventory in mid-July was Nashville, Tenn.
Market Data | Aug 3, 2018
U.S. multifamily rents reach new heights in July
Favorable economic conditions produce a sunny summer for the apartment sector.
Market Data | Aug 2, 2018
Nonresidential construction spending dips in June
“The hope is that June’s construction spending setback is merely a statistical aberration,” said ABC Chief Economist Anirban Basu.
Market Data | Aug 1, 2018
U.S. hotel construction pipeline continues moderate growth year-over-year
The hotel construction pipeline has been growing moderately and incrementally each quarter.
Market Data | Jul 30, 2018
Nonresidential fixed investment surges in second quarter
Nonresidential fixed investment represented an especially important element of second quarter strength in the advance estimate.
Market Data | Jul 11, 2018
Construction material prices increase steadily in June
June represents the latest month associated with rapidly rising construction input prices.
Market Data | Jun 26, 2018
Yardi Matrix examines potential regional multifamily supply overload
Outsize development activity in some major metros could increase vacancy rates and stagnate rent growth.


