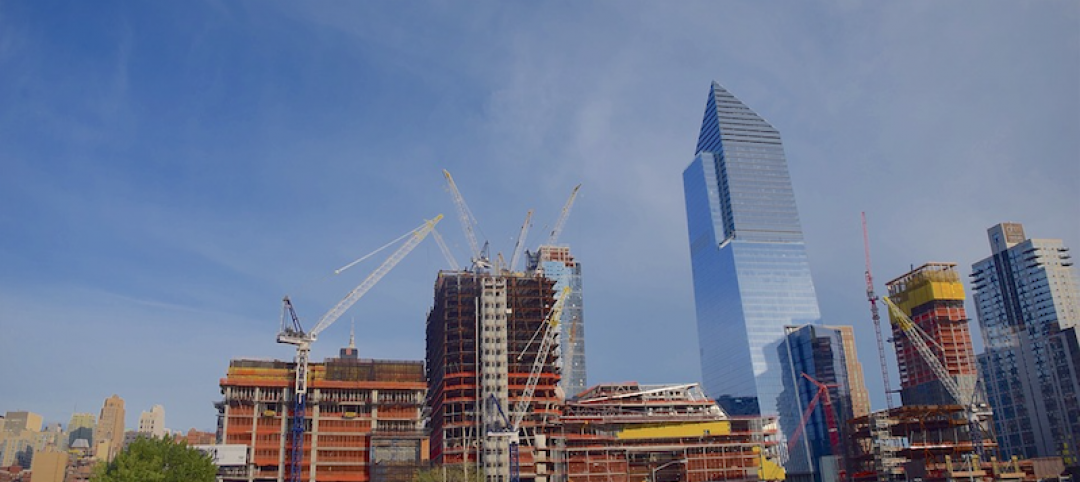
According to Lodging Econometrics’ (LE) most recent construction pipeline trend report, at the close of the second quarter, the top five markets with the largest hotel construction pipelines are New York City, with 146 projects/25,232 rooms; Los Angeles with 135 projects/22,586 rooms; Dallas with 132 projects/16,183 rooms; Atlanta with 129 projects/17,845 rooms; and Nashville with 91 projects/12,703 rooms.
The five top markets with the most projects currently under construction are New York City with 111 projects/19,582 rooms, Atlanta with 39 projects/5,795 rooms, Los Angeles with 34 projects/5,771 rooms, Dallas with 30 projects/4,173 rooms, and Austin with 29 projects/3,768 rooms. These five markets collectively account for nearly 25% of the total number of rooms currently under construction in the U.S.
According to LE’s research, many hotel owners, developers, and management groups have used the operational downtime, caused by COVID-19’s impact on operating performance, as an opportunity to upgrade and renovate their hotels and/or redefine their hotels with a brand conversion. In the second quarter of 2021, LE recorded a combined renovation and conversion total of 1,135 active projects with 176,445 rooms for the U.S. The markets with the largest combined number of renovations and conversions are New York with 25 projects/7,957 rooms, Houston with 24 projects/3,549 rooms, Los Angeles with 24 projects/3,423 rooms, Chicago with 20 projects/2,803 rooms, and Miami with 19 projects/2,305 rooms.
Despite previous, and in some cases, ongoing delays in the pipeline, and with the recent changes to travel restrictions and the summer travel season upon us, many developers are feeling more optimistic about the future of the lodging industry as new hotel announcements continue. In the second quarter of 2021, Memphis recorded the highest count of new projects announced into the pipeline with 8 projects/927 rooms. Austin followed with 7 projects/1,084 rooms, then Atlanta with 6 projects/658 rooms, Washington DC with 5 projects/1,554 rooms, and Miami with 5 projects/499 rooms.
Hotels forecast to open in 2021 are led by New York City with 59 projects/8,583 rooms for a 7.2% supply increase, followed by Orlando with 22 projects/ 3,555 rooms for a 2.6% supply increase, Nashville with 22 projects/2,938 rooms for a 5.7% supply increase, Atlanta with 22 projects/2,930 rooms for a 2.7% supply increase, and then Houston with 22 projects/2,470 rooms for a 2.7% supply increase.
In 2022, New York is forecast to, again, top the list of new hotel openings with 46 projects/7,934 rooms while at this time, Dallas is anticipated to lead in 2023 with 35 projects/4,013 rooms expected to open.
Related Stories
Market Data | Jun 21, 2017
Design billings maintain solid footing, strong momentum reflected in project inquiries/design contracts
Balanced growth results in billings gains in all sectors.
Market Data | Jun 16, 2017
Residential construction was strong, but not enough, in 2016
The Joint Center for Housing Studies’ latest report expects minorities and millennials to account for the lion’s share of household formations through 2035.
Industry Research | Jun 15, 2017
Commercial Construction Index indicates high revenue and employment expectations for 2017
USG Corporation (USG) and U.S. Chamber of Commerce release survey results gauging confidence among industry leaders.
Market Data | Jun 2, 2017
Nonresidential construction spending falls in 13 of 16 segments in April
Nonresidential construction spending fell 1.7% in April 2017, totaling $696.3 billion on a seasonally adjusted, annualized basis, according to analysis of U.S. Census Bureau data released today by Associated Builders and Contractors.
Industry Research | May 25, 2017
Project labor agreement mandates inflate cost of construction 13%
Ohio schools built under government-mandated project labor agreements (PLAs) cost 13.12 percent more than schools that were bid and constructed through fair and open competition.
Market Data | May 24, 2017
Design billings increasing entering height of construction season
All regions report positive business conditions.
Market Data | May 24, 2017
The top franchise companies in the construction pipeline
3 franchise companies comprise 65% of all rooms in the Total Pipeline.
Industry Research | May 24, 2017
These buildings paid the highest property taxes in 2016
Office buildings dominate the list, but a residential community climbed as high as number two on the list.
Market Data | May 16, 2017
Construction firms add 5,000 jobs in April
Unemployment down to 4.4%; Specialty trade jobs dip slightly.
Multifamily Housing | May 10, 2017
May 2017 National Apartment Report
Median one-bedroom rent rose to $1,012 in April, the highest it has been since January.


