The value of nonresidential building starts slightly fell in 2015, and was particularly soft in the latter months of the year, according to CMD Research Group.
The total value for nonresidential building stood at $186.307 billion in 2015, down 3.3% from 2014. Starts in December 2015 were 9.4% lower than the same month a year ago, and 7.3% lower than November 2015.
When heavy engineering, such as airport and highway construction, is thrown into the mix, the total value of nonresidential construction starts rose 1.9% to $309.221 billion. But heavy engineering, too, was softer in November and December.
The Industrial sector took the biggest hit last year, as manufacturing-related construction starts fell in value by 32.8% to $12.769 billion. Analysts have posited that manufacturing in the U.S. is suffering, in part, from the steady downturn in China’s economic growth.
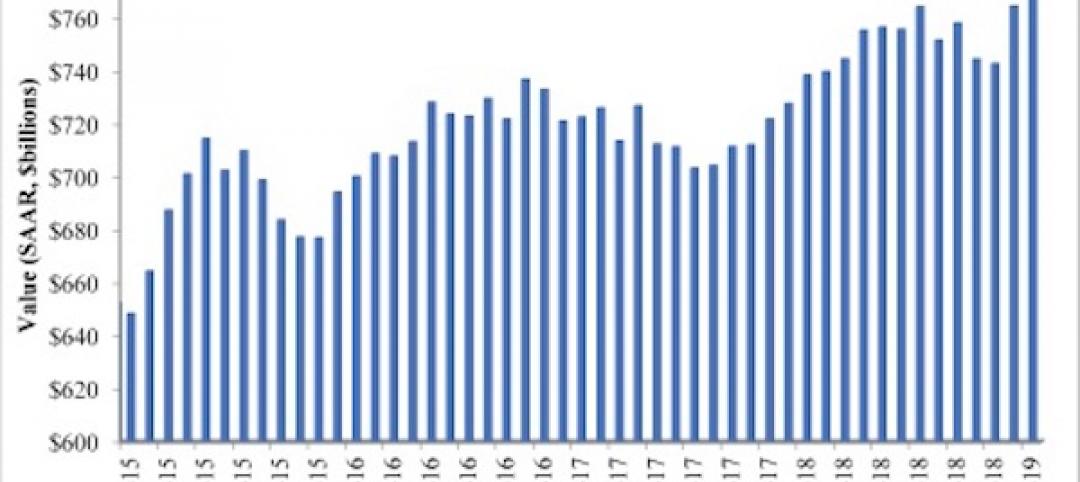
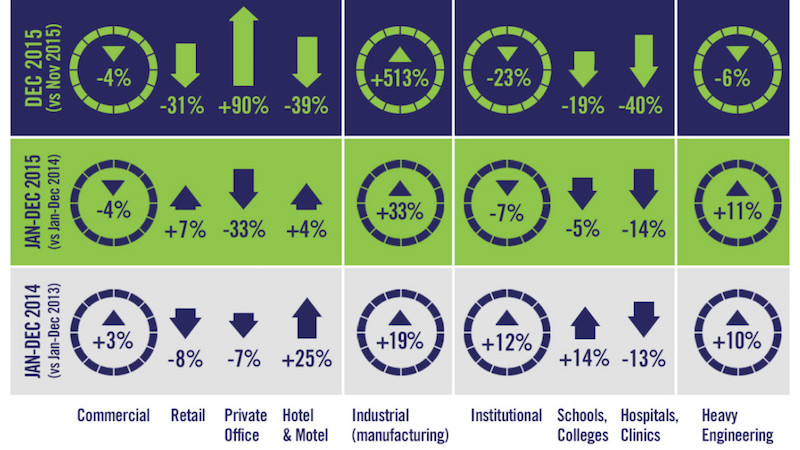 The last few months of 2015 were unkind to builders and developers, and pulled down the value of nonresidential construction starts, which ended the year up 1.9%. Nonresidential building starts were off 3.3%. Image courtesy of CMD Research Group.
Commercial construction was on shaky ground, too, as five of the 10 sectors that CMD tracks were negative. Private office building starts were down 32.6% to $11.828 billion, and the “amusement” category fell by 20.4% to $5.413 billion. On a positive note, Alex Carrick CMD’s chief economist, notes that commercial starts were buoyed by retail, which was down by 30.6% in December 2015 vs. December 2015, but still managed to show a positive full-year gain of 7.3% to $18.952 billion.
The wildest swing occurred in the warehouse sector, which cratered by 55.2% in December to December, but nonetheless finished full-year 2015 up 42.7% increase to $10.524 billion.
Schools and colleges accounted for 60% of the Institutional sector’s total starts. However, the category was off 18.7% in December compared to the same month in 2014, and down 4.5% for the full year, to $52.382 billion. The biggest institutional gainer was the police/prison/courthouse category, up 46.3% for the year to $5.664 billion.
CMD also provided a list of the 10 largest projects under construction in the U.S., led by the 40-story, $221 million mixed-use Milennium Tower in Boston. That’s followed by the 69-story commercial building at 401 9th Avenue in New York, whose start value CMD estimates at $317 million.
Related Stories
Market Data | Apr 18, 2019
ABC report: 'Confidence seems to be making a comeback in America'
The Construction Confidence Index remained strong in February, according to the Associated Builders and Contractors.
Market Data | Apr 16, 2019
ABC’s Construction Backlog Indicator rebounds in February
ABC's Construction Backlog Indicator expanded to 8.8 months in February 2019.
Market Data | Apr 8, 2019
Engineering, construction spending to rise 3% in 2019: FMI outlook
Top-performing segments forecast in 2019 include transportation, public safety, and education.
Market Data | Apr 1, 2019
Nonresidential spending expands again in February
Private nonresidential spending fell 0.5% for the month and is only up 0.1% on a year-over-year basis.
Market Data | Mar 22, 2019
Construction contractors regain confidence in January 2019
Expectations for sales during the coming six-month period remained especially upbeat in January.
Market Data | Mar 21, 2019
Billings moderate in February following robust New Year
AIA’s Architecture Billings Index (ABI) score for February was 50.3, down from 55.3 in January.
Market Data | Mar 19, 2019
ABC’s Construction Backlog Indicator declines sharply in January 2019
The Construction Backlog Indicator contracted to 8.1 months during January 2019.
Market Data | Mar 15, 2019
2019 starts off with expansion in nonresidential spending
At a seasonally adjusted annualized rate, nonresidential spending totaled $762.5 billion for the month.
Market Data | Mar 14, 2019
Construction input prices rise for first time since October
Of the 11 construction subcategories, seven experienced price declines for the month.
Market Data | Mar 6, 2019
Global hotel construction pipeline hits record high at 2018 year-end
There are a record-high 6,352 hotel projects and 1.17 million rooms currently under construction worldwide.


