


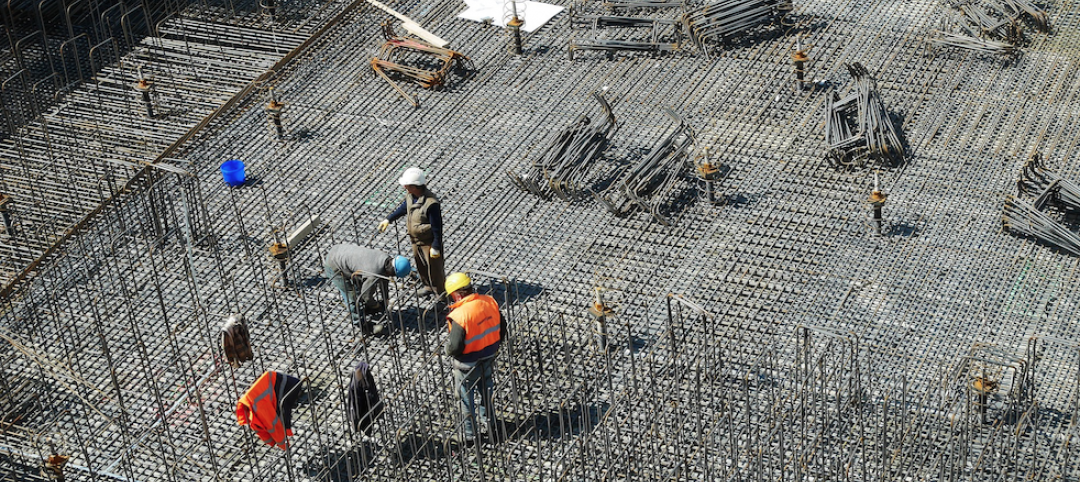
Nonresidential construction spending fell 2% in January, which is the largest setback to spending since January 2014, according to the March 2 release from the U.S. Census Bureau.
However, at $614.1 billion on a seasonally adjusted, annualized basis, nonresidential construction spending still is 4.8% higher than one year ago. In addition, the spending estimate for December 2014 was revised downward from $627.1 billion to $627 billion and November's figure was revised from $624.8 billion to $621.9 billion.
"Interpreting January construction statistics is always tricky because the seasonal adjustments can never precisely reflect the impact of any given winter or weather system," said Associated Builders and Contractors Chief Economist Anirban Basu. "New England, among other places, was hit heavily by snow in January and this could explain the monthly decline in nonresidential construction spending.
"Additionally, nonresidential construction spending enjoyed positive momentum through the end of 2014 and, until January, had registered spending growth in five of the previous six months," Basu said. "It is also possible that the West Coast port slowdown impacted construction volumes, including by reducing material availability."
Three of 16 nonresidential construction subsectors posted increases in spending in January on a monthly basis.
- Communication construction spending gained 0.7% for the month, but is down 1.5% for the year.
- Highway- and street-related construction spending grew 0.2% in January and is up 8.7% compared to the same time last year.
- Manufacturing-related spending expanded by 4% in January and is up 22.5% for the year.
Spending in 13 nonresidential construction subsectors declined in January.
- Health care-related construction spending fell 2.3% for the month and is down 2.5% for the year.
- Education-related construction spending fell 3.6% for the month and 0.4% on a year-over-year basis.
- Spending in the water supply category dropped 7.5% from December, but is 3.3% higher than at the same time last year.
- Construction spending in the transportation category fell 1.7% on a monthly basis, but has expanded 8.9% on an annual basis.
- Public safety-related construction spending declined 6.7% on a monthly basis and is down 14.5% on a year-over-year basis.
- Commercial construction spending decreased 5.7% in January, but is up 14% on a year-over-year basis.
- Religious spending fell 11.4% for the month and is down 12.4% compared to the same time last year.
- Lodging construction spending is down 4.4% on a monthly basis, but is up 18.2% on a year-over-year basis.
- Sewage and waste disposal-related construction spending shed 7.5% for the month, but has grown 16% on a 12-month basis.
- Power-related construction spending fell 1.1% for the month and is 13.2% lower than at the same time one year ago.
- Conservation and development-related construction spending fell 5.1% for the month but is up 25.6% on a yearly basis.
- Office-related construction spending declined 1.7% in January but is up 13.7% from the same time one year ago.
- Amusement and recreation-related construction spending fell 3.2% on a monthly basis but is up 19.3% from the same time last year.
- Sewage and waste disposal-related construction spending fell 2% for the month, but has grown 10.5% on a 12-month basis.
Related Stories

Building Team Awards | May 25, 2016
New health center campus provides affordable care for thousands of Northern Californians
The 38,000-sf, two-level John & Susan Sobrato Campus in Palo Alto is expected to serve 25,000 patients a year by the end of the decade.

Building Team Awards | May 24, 2016
Los Angeles bus depot squeezes the most from a tight site
The Building Team for the MTA Division 13 Bus Operations and Maintenance Facility fit 12 acres’ worth of programming in a multi-level structure on a 4.8-acre site.

Building Team Awards | May 23, 2016
'Greenest ballpark' proves a winner for St. Paul Saints
Solar arrays, a public art courtyard, and a picnic-friendly “park within a park" make the 7,210-seat CHS Field the first ballpark to meet Minnesota sustainable building standards.
Building Team Awards | May 19, 2016
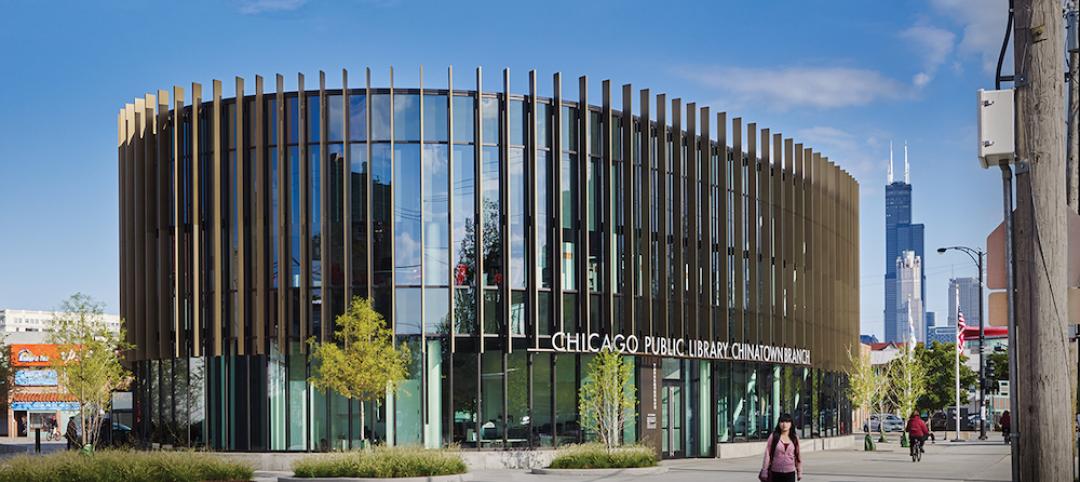
Chinatown library unites and serves two emerging Chicago neighborhoods
The 16,000-sf, pebble-shaped Chinatown Branch Library was built at the intersection of new and old Chinatown neighborhoods. The goal is for the building to unite the communities and serve as a catalyst for the developing area.
Building Team Awards | May 19, 2016
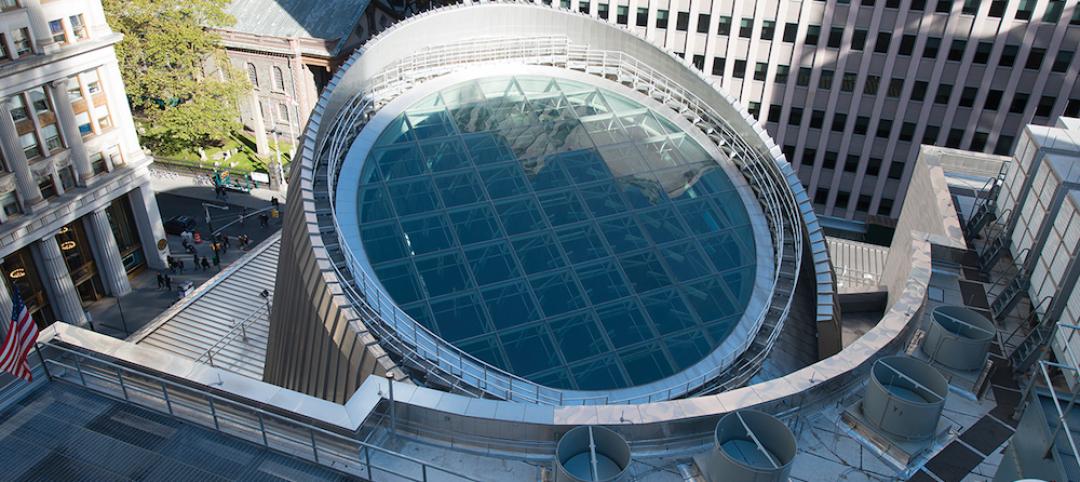
NYC subway station lights the way for 300,000 riders a day
Fulton Center, which handles 85% of the riders coming to Lower Manhattan, is like no other station in the city’s vast underground transit web—and that’s a good thing.
Market Data | May 17, 2016
Modest growth for AIA’s Architecture Billings Index in April
The American Institute of Architects reported the April ABI score was 50.6, down from the mark of 51.9 in the previous month. This score still reflects an increase in design services.

Retail Centers | May 10, 2016
5 factors guiding restaurant design
Restaurants are more than just places to eat. They are comprising town centers and playing into the future of brick-and-mortar retail.
AEC Tech | May 9, 2016
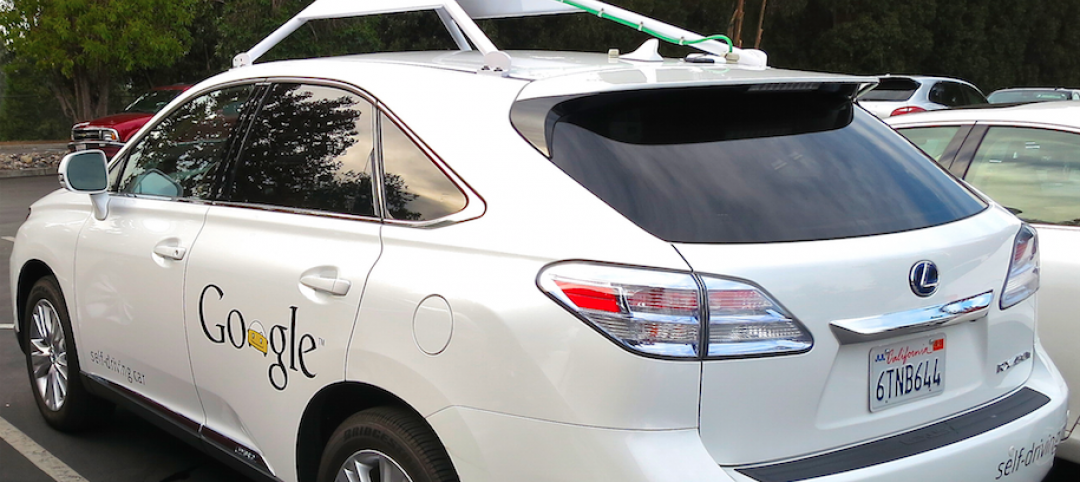
Is the nation’s grand tech boom really an innovation funk?
Despite popular belief, the country is not in a great age of technological and digital innovation, at least when compared to the last great innovation era (1870-1970).

Big Data | May 5, 2016
Demand for data integration technologies for buildings is expected to soar over the next decade
A Navigant Research report takes a deeper dive to examine where demand will be strongest by region and building type.

Urban Planning | May 4, 2016
Brookings report details how different industries innovate
In the new report, “How Firms Learn: Industry Specific Strategies for Urban Economies,” Brookings' Scott Andes examines how manufacturing and software services firms develop new products, processes, and ideas.


