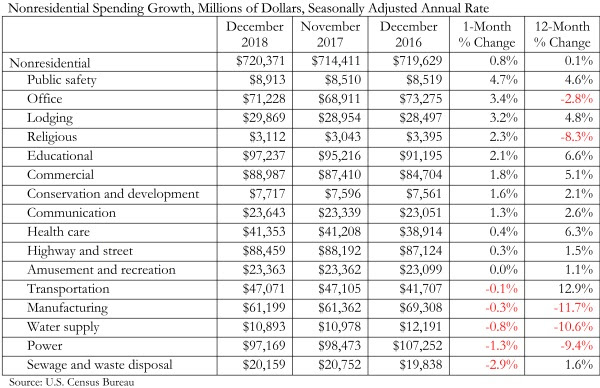
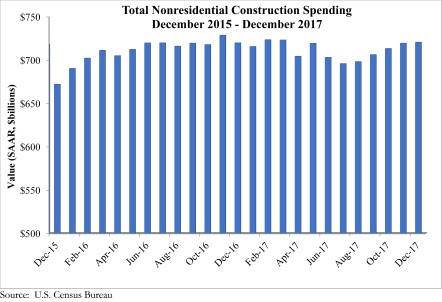
Nonresidential construction spending expanded 0.8% in December, totaling $720.4 billion on a seasonally adjusted basis, according to Associated Builders and Contractors’ (ABC) analysis of data released today by the U.S. Census Bureau. This represents the fifth consecutive month during which the pace of nonresidential spending has increased.
Nonresidential spending expanded 0.1% on a year-over-year basis and sits at its highest level since March. Private nonresidential construction spending increased 1.1% for the month, but is down 2.5% year over year, while public nonresidential spending increased 0.4% for the month and 4.4% for the year. Spending in the power and manufacturing categories, which are two of the largest nonresidential subsectors, contracted by a combined 10.3%, or $18.2 billion, since December 2016.
“While data releases are important for many reasons, including helping us to understand what happened in the past, their principal value lies in clarifying our shared understanding of the probable future,” said ABC Chief Economist Anirban Basu. “Today’s data release, which essentially confirms the existence of the ongoing construction expansion cycle, is less useful than usual. The obvious reason is that the December data reflect a pre-existing pattern of construction spending. The future is likely to represent a departure from prior trends, in large measure because of the recently passed tax reform bill.
“Even before the United States enacted tax reform, global and domestic financial systems were flush with liquidity and capital,” said Basu. “The tax cut will further bolster liquidity and confidence, which will ultimately translate into more construction starts and spending. If long-awaited progress is made on infrastructure spending, the construction recovery will likely transition from solid to spectacular. Note that the transportation category has already expanded 12.9% on a year-over-year basis. During much of the past three years, spending growth generally has been concentrated in a number of key private construction segments, while public construction has tended to lag.
“Of course, industry insiders are scratching their collective heads regarding how to amass enough human capital to actually deliver construction services on time and on budget,” said Basu. “Frankly, that’s a mystery. The implication is that any infrastructure package must be accompanied by action that helps expand apprenticeship programs, steps up investment in two-year colleges, encourages high schools to offer career and technical education, and encourages more people to leap into the U.S. labor force.”
Related Stories
Market Data | Feb 28, 2019
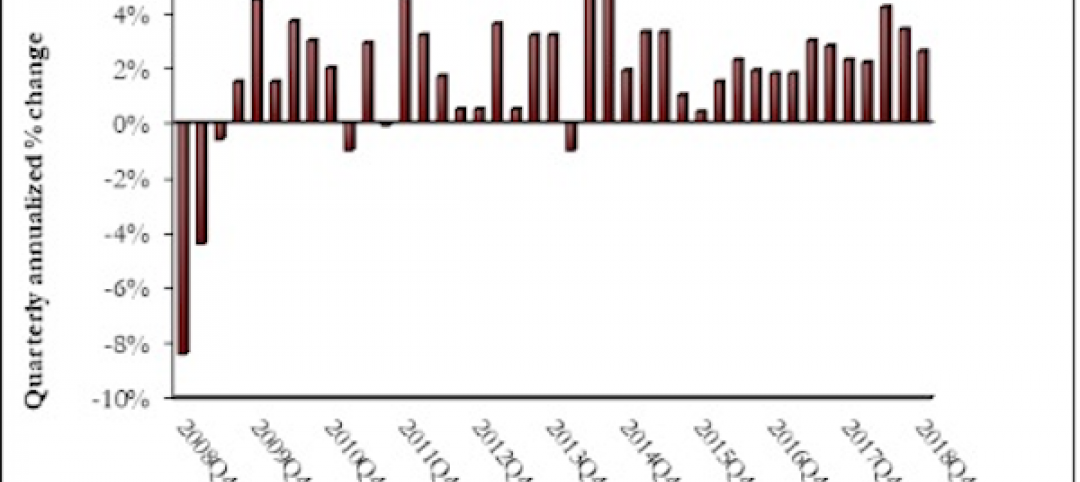
U.S. economic growth softens in final quarter of 2018
Year-over-year GDP growth was 3.1%, while average growth for 2018 was 2.9%.
Market Data | Feb 20, 2019
Strong start to 2019 for architecture billings
“The government shutdown affected architecture firms, but doesn’t appear to have created a slowdown in the profession,” said AIA Chief Economist Kermit Baker, Hon. AIA, PhD, in the latest ABI report.
Market Data | Feb 19, 2019
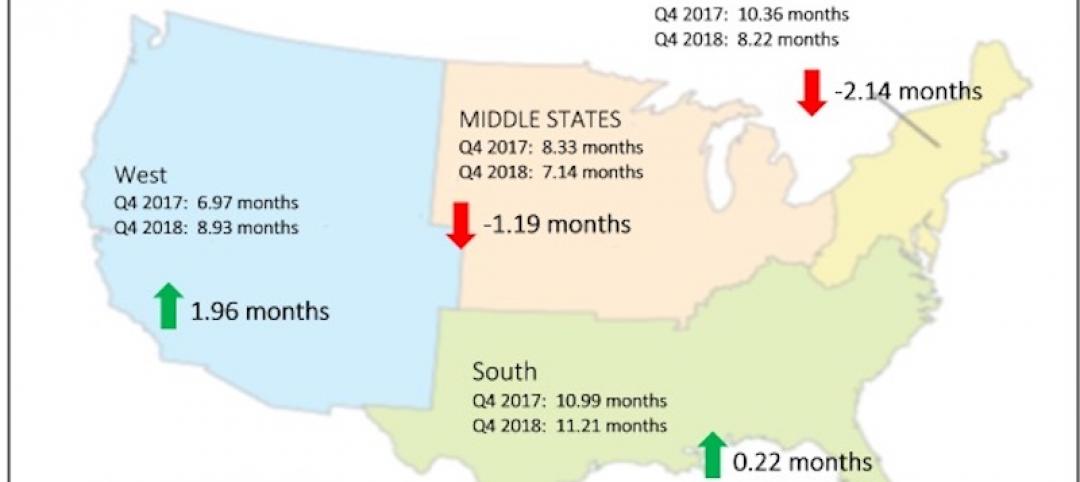
ABC Construction Backlog Indicator steady in Q4 2018
CBI reached a record high of 9.9 months in the second quarter of 2018 and averaged about 9.1 months throughout all four quarters of last year.
Market Data | Feb 14, 2019
U.S. Green Building Council announces top 10 countries and regions for LEED green building
The list ranks countries and regions in terms of cumulative LEED-certified gross square meters as of December 31, 2018.
Market Data | Feb 13, 2019
Increasingly tech-enabled construction industry powers forward despite volatility
Construction industry momentum to carry through first half of 2019.
Market Data | Feb 4, 2019
U.S. Green Building Council announces annual Top 10 States for LEED Green Building in 2018
Illinois takes the top spot as USGBC defines the next generation of green building with LEED v4.1.
Market Data | Feb 4, 2019
Nonresidential construction spending dips in November
Total nonresidential spending stood at $751.5 billion on a seasonally adjusted annualized rate.
Market Data | Feb 1, 2019
The year-end U.S. hotel construction pipeline continues steady growth trend
Project counts in the early planning stage continue to rise reaching an all-time high of 1,723 projects/199,326 rooms.
Market Data | Feb 1, 2019
Construction spending is projected to increase by more than 11% through 2022
FMI’s annual outlook also expects the industry’s frantic M&A activity to be leavened by caution going forward.
Market Data | Jan 23, 2019
Architecture billings slow, but close 2018 with growing demand
AIA’s Architecture Billings Index (ABI) score for December was 50.4 compared to 54.7 in November.


