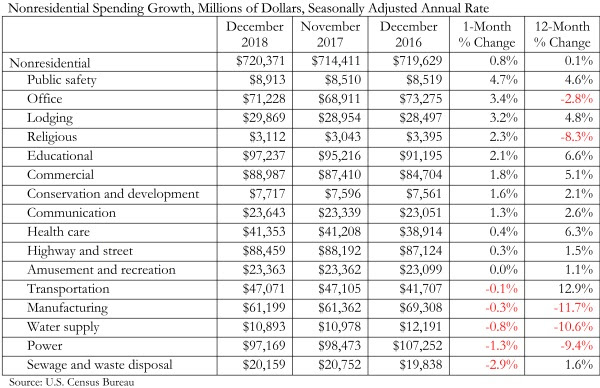
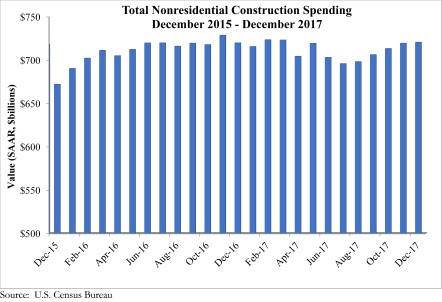
Nonresidential construction spending expanded 0.8% in December, totaling $720.4 billion on a seasonally adjusted basis, according to Associated Builders and Contractors’ (ABC) analysis of data released today by the U.S. Census Bureau. This represents the fifth consecutive month during which the pace of nonresidential spending has increased.
Nonresidential spending expanded 0.1% on a year-over-year basis and sits at its highest level since March. Private nonresidential construction spending increased 1.1% for the month, but is down 2.5% year over year, while public nonresidential spending increased 0.4% for the month and 4.4% for the year. Spending in the power and manufacturing categories, which are two of the largest nonresidential subsectors, contracted by a combined 10.3%, or $18.2 billion, since December 2016.
“While data releases are important for many reasons, including helping us to understand what happened in the past, their principal value lies in clarifying our shared understanding of the probable future,” said ABC Chief Economist Anirban Basu. “Today’s data release, which essentially confirms the existence of the ongoing construction expansion cycle, is less useful than usual. The obvious reason is that the December data reflect a pre-existing pattern of construction spending. The future is likely to represent a departure from prior trends, in large measure because of the recently passed tax reform bill.
“Even before the United States enacted tax reform, global and domestic financial systems were flush with liquidity and capital,” said Basu. “The tax cut will further bolster liquidity and confidence, which will ultimately translate into more construction starts and spending. If long-awaited progress is made on infrastructure spending, the construction recovery will likely transition from solid to spectacular. Note that the transportation category has already expanded 12.9% on a year-over-year basis. During much of the past three years, spending growth generally has been concentrated in a number of key private construction segments, while public construction has tended to lag.
“Of course, industry insiders are scratching their collective heads regarding how to amass enough human capital to actually deliver construction services on time and on budget,” said Basu. “Frankly, that’s a mystery. The implication is that any infrastructure package must be accompanied by action that helps expand apprenticeship programs, steps up investment in two-year colleges, encourages high schools to offer career and technical education, and encourages more people to leap into the U.S. labor force.”
Related Stories
Market Data | Jun 21, 2017
Design billings maintain solid footing, strong momentum reflected in project inquiries/design contracts
Balanced growth results in billings gains in all sectors.
Market Data | Jun 16, 2017
Residential construction was strong, but not enough, in 2016
The Joint Center for Housing Studies’ latest report expects minorities and millennials to account for the lion’s share of household formations through 2035.
Industry Research | Jun 15, 2017
Commercial Construction Index indicates high revenue and employment expectations for 2017
USG Corporation (USG) and U.S. Chamber of Commerce release survey results gauging confidence among industry leaders.
Market Data | Jun 2, 2017
Nonresidential construction spending falls in 13 of 16 segments in April
Nonresidential construction spending fell 1.7% in April 2017, totaling $696.3 billion on a seasonally adjusted, annualized basis, according to analysis of U.S. Census Bureau data released today by Associated Builders and Contractors.
Industry Research | May 25, 2017
Project labor agreement mandates inflate cost of construction 13%
Ohio schools built under government-mandated project labor agreements (PLAs) cost 13.12 percent more than schools that were bid and constructed through fair and open competition.
Market Data | May 24, 2017
Design billings increasing entering height of construction season
All regions report positive business conditions.
Market Data | May 24, 2017
The top franchise companies in the construction pipeline
3 franchise companies comprise 65% of all rooms in the Total Pipeline.
Industry Research | May 24, 2017
These buildings paid the highest property taxes in 2016
Office buildings dominate the list, but a residential community climbed as high as number two on the list.
Market Data | May 16, 2017
Construction firms add 5,000 jobs in April
Unemployment down to 4.4%; Specialty trade jobs dip slightly.
Multifamily Housing | May 10, 2017
May 2017 National Apartment Report
Median one-bedroom rent rose to $1,012 in April, the highest it has been since January.


