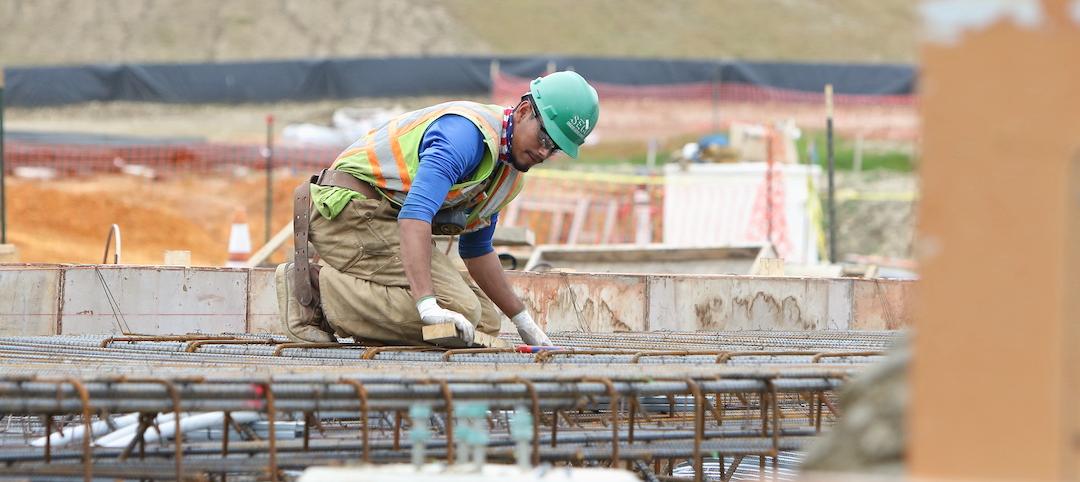
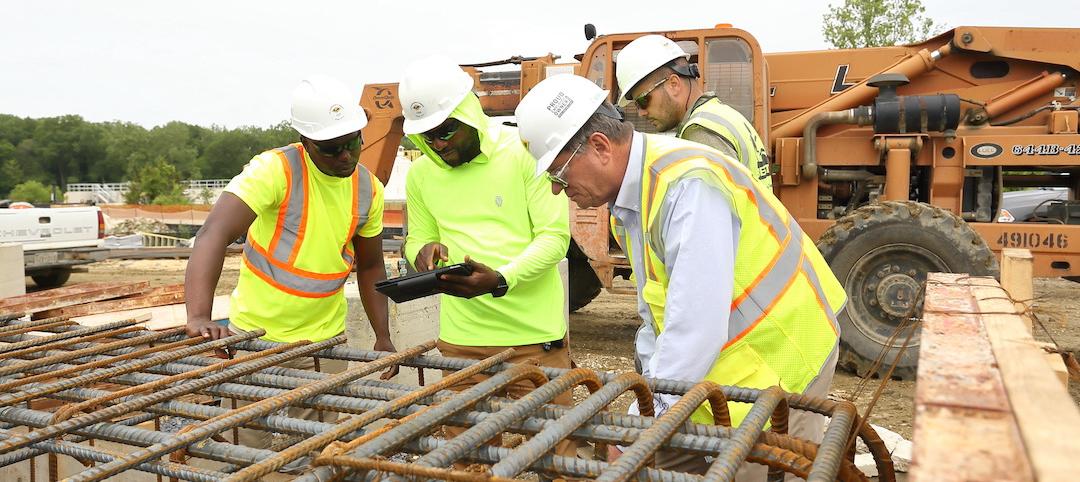
Nonresidential construction spending fell 1.7% in April 2017, totaling $696.3 billion on a seasonally adjusted, annualized basis, according to analysis of U.S. Census Bureau data released today by Associated Builders and Contractors (ABC).
In April, private nonresidential construction spending fell 0.6% for the month, but has increased 4.3% on a year-ago basis. Public nonresidential spending decreased by 3.4% and is down 4.2 % year-over-year. Declines in nonresidential construction spending for the month were largely attributable to drops in spending in the highway and street and power segments, down $3.5 billion and $2.1 billion, respectively.
“A staggering 13 of 16 nonresidential construction segments experienced spending declines in April,” said ABC Chief Economist Anirban Basu. “While poor weather interrupted a considerable amount of economic activity in the Northeast in March—which produced March’s weak jobs report, among other things—weather generally improved in April. This would normally suggest expansion in nonresidential construction spending in on a monthly basis; however, that is not reflected in the April data.
“Instead, public nonresidential construction spending continued to demonstrate substantial weakness with one noteworthy exception, water supply, which produced a small increase,” said Basu. “Among the private categories only office, which was flat, and commercial, which sustained only a small monthly decline, reported stable spending amounts. Both categories have seen a year-over-year spending expansion of 12.4%.
“There are a number of explanatory factors,” said Basu. “First, there are survey data from the Federal Reserve indicating that bank lending to commercial real estate has begun to tighten, perhaps because of growing fears of overbuilding in certain markets. Uncertainty at the federal agency level is also likely having an impact, including in public segments like highway and street that depend heavily on federal outlays. Finally, certain economic decision-makers may have ratcheted down their projections of economic growth in 2017 and 2018, resulting in more hesitation with respect to moving forward with projects at various stages of development.”
February’s initial estimate, which was revised higher last month, was revised lower this month. The revision translates into a decline of $9.6 billion, or 1.3%. March’s value was relatively unchanged at around $708.6 billion.
Related Stories
Market Data | Nov 22, 2021
Only 16 states and D.C. added construction jobs since the pandemic began
Texas, Wyoming have worst job losses since February 2020, while Utah, South Dakota add the most.
Market Data | Nov 10, 2021
Construction input prices see largest monthly increase since June
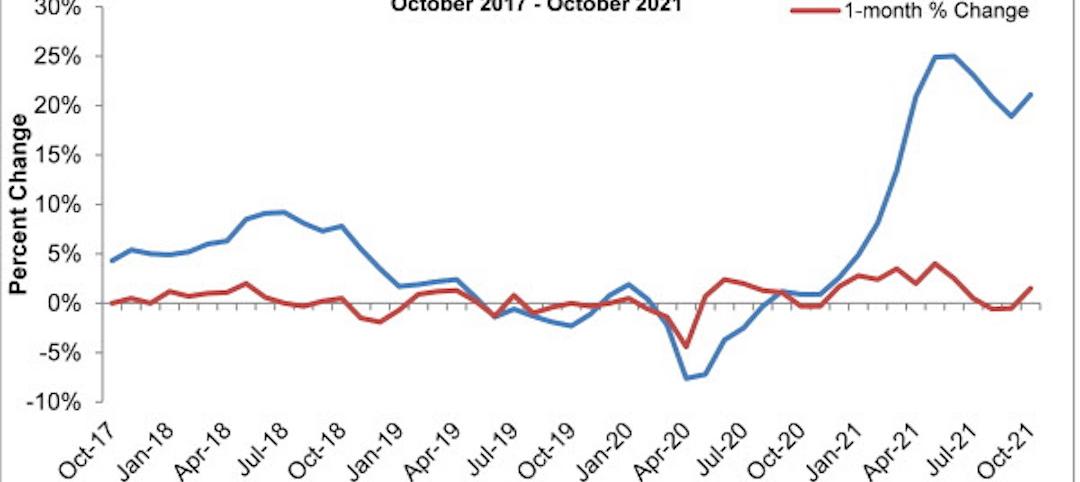
Construction input prices are 21.1% higher than in October 2020.
Market Data | Nov 9, 2021
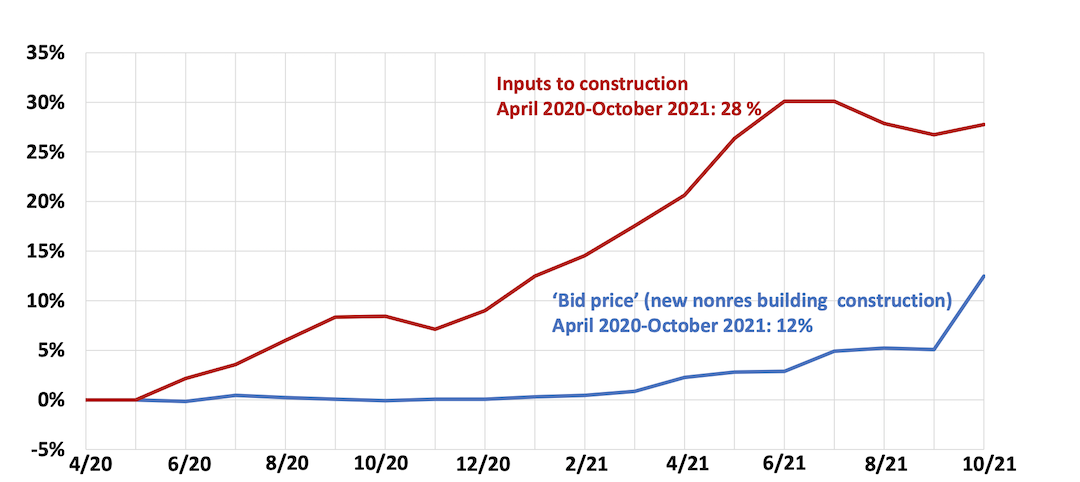
Continued increases in construction materials prices starting to drive up price of construction projects
Supply chain and labor woes continue.
Market Data | Nov 5, 2021
Construction firms add 44,000 jobs in October
Gain occurs even as firms struggle with supply chain challenges.
Market Data | Nov 3, 2021
One-fifth of metro areas lost construction jobs between September 2020 and 2021
Beaumont-Port Arthur, Texas and Sacramento--Roseville--Arden-Arcade Calif. top lists of gainers.
Market Data | Nov 2, 2021
Construction spending slumps in September
A drop in residential work projects adds to ongoing downturn in private and public nonresidential.
Hotel Facilities | Oct 28, 2021
Marriott leads with the largest U.S. hotel construction pipeline at Q3 2021 close
In the third quarter alone, Marriott opened 60 new hotels/7,882 rooms accounting for 30% of all new hotel rooms that opened in the U.S.
Hotel Facilities | Oct 28, 2021
At the end of Q3 2021, Dallas tops the U.S. hotel construction pipeline
The top 25 U.S. markets account for 33% of all pipeline projects and 37% of all rooms in the U.S. hotel construction pipeline.
Market Data | Oct 27, 2021
Only 14 states and D.C. added construction jobs since the pandemic began
Supply problems, lack of infrastructure bill undermine recovery.
Market Data | Oct 26, 2021
U.S. construction pipeline experiences highs and lows in the third quarter
Renovation and conversion pipeline activity remains steady at the end of Q3 ‘21, with conversion projects hitting a cyclical peak, and ending the quarter at 752 projects/79,024 rooms.


