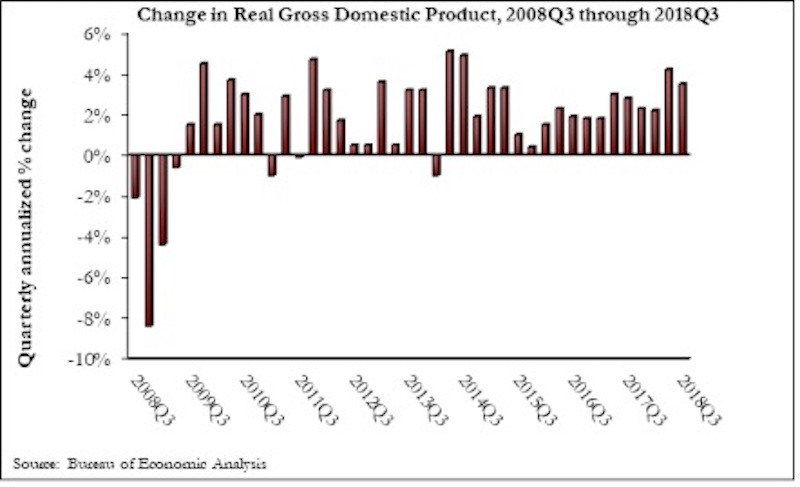
The U.S. economy expanded at a 3.5% annualized rate during the third quarter of 2018, according to an Associated Builders and Contractors analysis of U.S. Bureau of Economic Analysis data released today. This represents the first time there have been two consecutive quarters of 3%-plus growth since the beginning of 2015.
Despite the broader economic growth, fixed investment inched 0.3% lower in the third quarter. Nonresidential fixed investment increased at just a 0.8% annualized rate, a stark reversal from the 11.5% and 8.7% growth observed in the first and second quarters, respectively. Investment in structures plummeted 7.9% after increasing by 13.9% and 14.5% in the previous two quarters.
“While the GDP increased, business investment, including investment in structures, was generally disappointing,” said ABC Chief Economist Anirban Basu. “Today’s GDP release is consistent with other data indicating a recent softening in capital expenditures, which caught many observers by surprise. Coming into the year, the expectation among many was that corporate tax cuts would translate into a lengthy period of rising business investment.
“As always, there are multiple explanations for the observed slowing in capital expenditures,” said Basu. “The first is simply that this represents an inevitable moderation in fixed business investment after the stunning growth in investment registered during the year’s initial two quarters. A second explanation, however, is not nearly as benign. This explanation focuses on both the growing constraints that businesses face due to a lack of trained workers available to work on new equipment, as well as the impact of rising input costs. Corporate earnings are no longer as consistently surprising to the upside, an indication of the impact of rising business costs. It may be that the dislocation created by ongoing trade skirmishes is also inducing certain firms to invest less in equipment and structures.
“If the first explanation is correct, one would expect a bounce back in capital expenditures,” said Basu. “The logic is that the U.S. business community has taken a bit of a breather to digest all of the capital investments undertaken during the first half of 2018. However, the second would indicate economic growth and the pace of hiring to soften in 2019. That obviously would not be a welcome dynamic for America’s construction sector.”
Related Stories
Market Data | Aug 12, 2021
Steep rise in producer prices for construction materials and services continues in July.
The producer price index for new nonresidential construction rose 4.4% over the past 12 months.
Market Data | Aug 6, 2021
Construction industry adds 11,000 jobs in July
Nonresidential sector trails overall recovery.
Market Data | Aug 2, 2021
Nonresidential construction spending falls again in June
The fall was driven by a big drop in funding for highway and street construction and other public work.
Market Data | Jul 29, 2021
Outlook for construction spending improves with the upturn in the economy
The strongest design sector performers for the remainder of this year are expected to be health care facilities.
Market Data | Jul 29, 2021
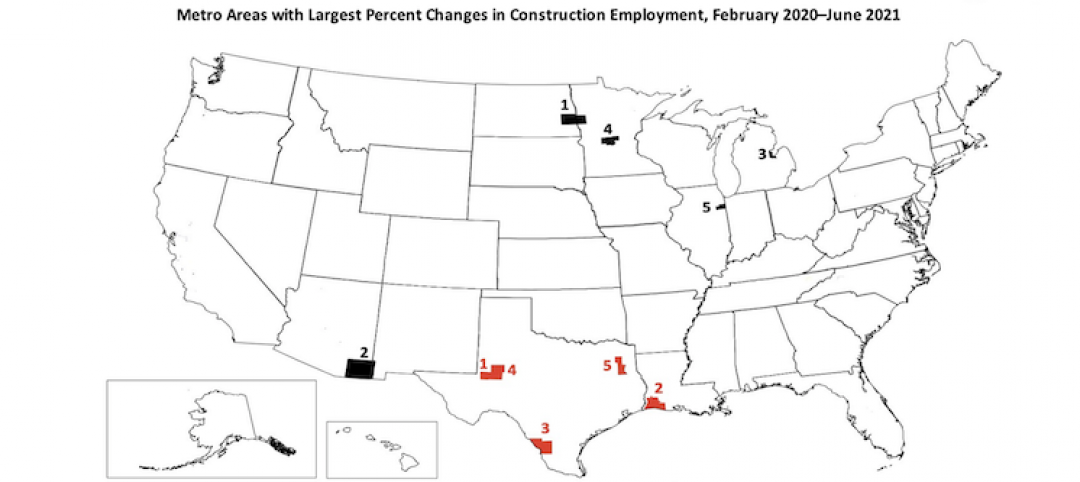
Construction employment lags or matches pre-pandemic level in 101 metro areas despite housing boom
Eighty metro areas had lower construction employment in June 2021 than February 2020.
Market Data | Jul 28, 2021
Marriott has the largest construction pipeline of U.S. franchise companies in Q2‘21
472 new hotels with 59,034 rooms opened across the United States during the first half of 2021.
Market Data | Jul 27, 2021
New York leads the U.S. hotel construction pipeline at the close of Q2‘21
Many hotel owners, developers, and management groups have used the operational downtime, caused by COVID-19’s impact on operating performance, as an opportunity to upgrade and renovate their hotels and/or redefine their hotels with a brand conversion.
Market Data | Jul 26, 2021
U.S. construction pipeline continues along the road to recovery
During the first and second quarters of 2021, the U.S. opened 472 new hotels with 59,034 rooms.
Market Data | Jul 21, 2021
Architecture Billings Index robust growth continues
AIA’s Architecture Billings Index (ABI) score for June remained at an elevated level of 57.1.
Market Data | Jul 20, 2021
Multifamily proposal activity maintains sizzling pace in Q2
Condos hit record high as all multifamily properties benefit from recovery.


