


Pop quiz time: Of the total retail sales in 2013, what percentage came from online shopping?
Twenty-five percent? Nope, lower. Twenty percent? Not even close. Ten percent? Getting warmer.
Would you believe that, even with the e-commerce sector’s torrid pace of growth during the past decade, online sales represented just 6% of all retail business last year?
The gloom-and-doom scenario for bricks-and-mortar retail that is portrayed in the media is grossly overstated. It makes for good headlines, but it’s not based in fact, according to Jones Lang LaSalle’s latest retail sector outlook.
“Remember catalogs? Flipping through the pages, dialing up a call center, and placing an order? Web sales are really just replacing that,” said Kris Cooper, Managing Director, JLL Capital Markets. “People still need to see and touch things. The instant gratification of an in-store purchase can’t be discounted. Retailers who want to thrive will need to incorporate it all—hands-on goods, e-commerce, and mobile commerce.”
Giants 300 coverage of Retail brought to you by: C.R. Laurence www.crlaurence.com.
That’s not to say the retail sector doesn’t have its issues. There has been a spate of big-name store closings recently—including Coldwater Creek, Office Depot, and Radio Shack—and retailers continue to struggle to adjust to the structural changes occurring in their industry.
But, all in all, the U.S. retail sector is faring quite well, according to JLL, continuing its solid recovery and exhibiting tightening market conditions. The real estate group expects asking rents nationally to rise 2.7% this year, following 1.1% growth in 2013, and vacancy rates to drop more than 6% for the second straight year.
Net absorption was up a whopping 42% in 2013, to 83.2 million sf. With increased demand for retail space, landlords are starting to exert some power in tenant selection and lease terms, according to JLL.
Here are some highlights from the firm’s Spring 2014 Cross Sector Outlook (http://tinyurl.com/JLLCrossSectorOutlook):
• Power centers are experiencing the tightest overall market conditions, with a total vacancy rate of just 5.1%.
• Investment dollars are flowing into high-quality, grocery-anchored centers and trophy malls. “Demand for those asset types is incredible right now—if only we could convince all the owners to bring those to market,” said Margaret Caldwell, Managing Director, JLL Capital Markets.
• Construction growth will remain marginal during the next 12 months. New construction is focused primarily on single-tenant big-box and discount/wholesale space. Of the multi-tenant projects under construction, the majority are in urban cores and peripheral outlet centers.
• As the market continues to recover, the retail construction sector will eventually see an uptick in construction where tenants demand new space because supply is so constrained, where rents are high enough to justify construction, and where there are few barriers to new development, such as Orlando, Fla.
• Retail property transactions were strong in 2013. Sales of significant retail properties totaled more than $60.8 billion in 2013, up 8% from the previous year. Sales of strip centers and single-tenant properties fared even better, rising 26% year over year.
• There are strong opportunities for development in Sunbelt markets with higher-than-average population growth rates, including Charlotte, N.C., Orlando, and Raleigh, N.C.
SIGNS OF LIFE FOR SHOPPING CENTERS
For the first time since 2007, shopping center development in the U.S. increased year over year, according to Cushman & Wakefield’s new Global Shopping Center Development Report (http://tinyurl.com/CWreport). Nearly 400 shopping centers totaling more than 12.2 million sm of gross leasable area (GLA) were completed in 2013, an increase of 12.7% compared to the previous year.
In fact, the U.S. has accounted for roughly 18% of all new shopping center space delivered worldwide since 2008, according to the report. And there’s no slowdown in sight.
During the next three years, an additional 758 centers containing approximately 11.2 million sm of new GLA will be added to the U.S. inventory, two-thirds of which is expected to be completed in 2014 alone. Developments in California, Florida, and Texas will make up about a third of all new shopping center construction during this period, according to Cushman & Wakefield.
While the large malls get all the headlines—like the long-delayed, 274,000-sm American Dream Meadowlands development in East Rutherford, N.J., and the 149,000-sm Shops at Summerlin (Nev.) Centre—the vast majority of new construction projects are small shopping centers, between 5,000 sm and 20,000 sm, with the average project at 17,700 sm.
Top Retail Architecture Firms
| Rank | Company | 2013 Retail Revenue |
| 1 | Callison | $109,251,013 |
| 2 | Gensler | 105,979,349 |
| 3 | RTKL Associates | 66,018,000 |
| 4 | MulvannyG2 Architecture | 60,000,000 |
| 5 | Stantec | 57,434,454 |
| 6 | WD Partners | 44,000,000 |
| 7 | RSP Architects | 36,346,000 |
| 8 | Little | 27,786,704 |
| 9 | MBH Architects | 25,106,000 |
| 10 | FRCH Design Worldwide | 24,600,000 |
| 11 | P+R Architects | 19,191,791 |
| 12 | Architects Orange | 14,036,393 |
| 13 | CTA Architects Engineers | 14,020,991 |
| 14 | DLR Group | 13,900,000 |
| 15 | NORR | 12,997,934 |
| 16 | CASCO Diversified Corp. | 12,500,000 |
| 17 | Bergmann Associates | 12,416,000 |
| 18 | Nadel | 9,000,000 |
| 19 | Perkins Eastman | 7,750,000 |
| 20 | Ware Malcomb | 7,600,000 |
| 21 | HOK | 7,345,023 |
| 22 | Good Fulton & Farrell | 7,324,000 |
| 23 | LawKingdon Architecture | 7,250,000 |
| 24 | Cooper Carry | 4,000,988 |
| 25 | API | 3,800,000 |
| 26 | Massa Montalto Architects | 3,482,000 |
| 27 | Beyer Blinder Belle | 3,205,403 |
| 28 | RS&H | 2,450,000 |
| 29 | Smallwood, Reynolds, Stewart, Stewart & Associates | 2,391,617 |
| 30 | Vocon | 2,366,525 |
| 31 | Gresham, Smith and Partners | 2,299,000 |
| 32 | Cuningham Group Architecture | 2,166,411 |
| 33 | ai Design Group | 2,093,530 |
| 34 | Solomon Cordwell Buenz | 1,700,000 |
| 35 | LPA | 1,637,397 |
| 36 | BLTa | 1,302,000 |
| 37 | NBBJ | 1,285,000 |
| 38 | Kohn Pedersen Fox Associates | 1,280,000 |
| 39 | TK Architects | 1,155,876 |
| 40 | LS3P | 1,061,129 |
| 41 | Ratio Architects | 990,326 |
| 42 | Eppstein Uhen Architects | 954,480 |
| 43 | RDH Interests | 922,242 |
| 44 | Carrier Johnson + Culture | 702,235 |
| 45 | Environetics | 625,747 |
| 46 | Colkitt & Company | 600,000 |
| 47 | GBBN Architects | 558,000 |
| 48 | Harvard Jolly Architecture | 533,943 |
| 49 | VOA Associates | 521,057 |
| 50 | JRS Architect | 490,000 |
| 51 | WATG | Wimberly Interiors | 472,000 |
| 52 | SchenkelShultz Architecture | 453,000 |
| 53 | Nelson | 393,822 |
| 54 | Goodwyn Mills & Cawood | 378,423 |
| 55 | Wight & Company | 371,000 |
| 56 | Moody Nolan | 361,308 |
| 57 | PGAL | 350,300 |
| 58 | Parkhill, Smith & Cooper | 336,000 |
| 59 | Montroy Andersen DeMarco | 310,000 |
| 60 | Becker Morgan Group | 287,996 |
| 61 | PHX Architecture | 280,000 |
| 62 | Morris Architects | 260,000 |
| 63 | BRPH | 225,000 |
| 64 | Mithun | 210,000 |
| 65 | FitzGerald Associates Architects | 151,500 |
| 66 | Clark Nexsen | 143,328 |
| 67 | Commonwealth Architects | 141,268 |
| 68 | Baskervill | 115,284 |
| 69 | Skidmore, Owings & Merrill | 108,913 |
| 70 | Adache Group Architects | 100,000 |
| 71 | Corgan | 74,847 |
| 72 | Hnedak Bobo Group | 72,000 |
| 73 | Hoefer Wysocki Architecture | 70,000 |
| 74 | Niles Bolton Associates | 65,728 |
| 75 | ATA Beilharz Architects | 60,180 |
| 76 | Hensley Lamkin Rachel | 50,000 |
| 77 | KZF Design | 47,356 |
| 78 | Heery International | 45,840 |
| 79 | TEG Architects | 12,163 |
Top Retail Engineering Firms
| Rank | Company | 2013 Retail Revenue |
| 1 | Jacobs | $182,720,000 |
| 2 | AECOM Technology Corp. | 105,890,000 |
| 3 | Henderson Engineers | 43,369,857 |
| 4 | URS Corp. | 36,003,188 |
| 5 | Wiss, Janney, Elstner Associates | 19,090,000 |
| 6 | Parsons Brinckerhoff | 16,431,889 |
| 7 | Dewberry | 9,513,612 |
| 8 | Thornton Tomasetti | 8,339,454 |
| 9 | Wallace Engineering | 7,667,000 |
| 10 | KLH Engineers | 6,506,748 |
| 11 | Shive-Hattery | 6,232,480 |
| 12 | Arup | 5,674,014 |
| 13 | Dunham Associates | 5,500,000 |
| 14 | Highland Associates | 4,600,000 |
| 15 | Magnusson Klemencic Associates | 4,133,492 |
| 16 | Coffman Engineers | 3,992,285 |
| 17 | Hixson Architecture, Engineering, Interiors | 3,100,000 |
| 18 | Davis, Bowen & Friedel | 2,748,648 |
| 19 | Leidos | 2,520,000 |
| 20 | WSP Group | 2,270,000 |
| 21 | Fishbeck, Thompson, Carr & Huber | 2,200,000 |
| 22 | AKF Group | 2,140,000 |
| 23 | French & Parrello Associates | 1,985,000 |
| 24 | KJWW Engineering Consultants | 1,686,418 |
| 25 | RDK Engineers | 1,670,000 |
| 26 | Martin/Martin | 1,614,144 |
| 27 | Interface Engineering | 1,573,325 |
| 28 | Simpson Gumpertz & Heger | 1,570,000 |
| 29 | Aon Fire Protection Engineering Corp. | 1,500,000 |
| 30 | CTLGroup | 1,450,000 |
| 31 | SSOE Group | 1,423,552 |
| 32 | Graef | 1,189,813 |
| 33 | Bala Consulting Engineers | 1,051,000 |
| 34 | M-E Engineers | 1,000,000 |
| 35 | Heapy Engineering | 969,445 |
| 36 | Wick Fisher White | 893,105 |
| 37 | OLA Consulting Engineers | 888,800 |
| 38 | Walter P Moore and Associates | 847,312 |
| 39 | TTG | 732,500 |
| 40 | DeSimone Consulting Engineers | 691,425 |
| 41 | H.F. Lenz | 652,000 |
| 42 | Paulus, Sokolowski and Sartor | 650,000 |
| 43 | I. C. Thomasson Associates | 600,000 |
| 44 | Vanderweil Engineers | 576,000 |
| 45 | Stanley Consultants | 447,960 |
| 46 | Zak Companies | 422,811 |
| 47 | Glumac | 421,563 |
| 48 | Allen & Shariff | 400,000 |
| 49 | KCI Technologies | 400,000 |
| 50 | Spectrum Engineers | 345,820 |
| 51 | TLC Engineering for Architecture | 342,071 |
| 52 | G&W Engineering Corp. | 217,100 |
| 53 | Sparling | 204,890 |
| 54 | Total Building Commissioning | 125,702 |
| 55 | Apogee Consulting Group | 115,325 |
| 56 | Barge Waggoner Sumner & Cannon | 100,000 |
| 57 | Brinjac Engineering | 80,270 |
| 58 | GHT Limited | 75,000 |
Top Retail Construction Firms
| Rank | Company | 2013 Retail Revenue |
| 1 | PCL Construction | $517,371,436 |
| 2 | Whiting-Turner Contracting Co., The | 479,057,948 |
| 3 | Shawmut Design and Construction | 386,000,000 |
| 4 | EMJ Corp. | 317,000,000 |
| 5 | Turner Construction | 236,380,000 |
| 6 | Balfour Beatty US | 195,847,685 |
| 7 | Lend Lease | 150,997,000 |
| 8 | Yates Companies, The | 122,000,000 |
| 9 | Hawkins Construction | 98,500,000 |
| 10 | Gray Construction | 97,770,000 |
| 11 | O'Neil Industries/W.E. O'Neil | 93,703,312 |
| 12 | Beck Group, The | 81,576,752 |
| 13 | Power Construction | 78,000,000 |
| 14 | S. M. Wilson & Co. | 72,877,695 |
| 15 | E.W. Howell | 71,900,000 |
| 16 | Structure Tone | 71,080,000 |
| 17 | DPR Construction | 70,199,893 |
| 18 | Choate Construction | 68,627,625 |
| 19 | KBE Building Corp. | 68,022,822 |
| 20 | Ryan Companies US | 67,191,615 |
| 21 | Weitz Company, The | 64,819,854 |
| 22 | Pepper Construction | 62,870,000 |
| 23 | JE Dunn Construction | 62,738,348 |
| 24 | Graycor | 59,864,863 |
| 25 | Hoar Construction | 53,500,000 |
| 26 | Hill & Wilkinson | 51,935,000 |
| 27 | McCarthy Holdings | 50,650,000 |
| 28 | Management Resource Systems | 45,255,861 |
| 29 | Leopardo Companies | 39,729,783 |
| 30 | Weis Builders | 37,993,000 |
| 31 | URS Corp. | 36,003,188 |
| 32 | Layton Construction | 35,900,000 |
| 33 | Clark Group | 35,131,316 |
| 34 | Brasfield & Gorrie | 33,249,173 |
| 35 | EBCO General Contractor | 33,134,000 |
| 36 | JLL | 30,323,117 |
| 37 | Paric Corp. | 25,000,000 |
| 38 | Skanska USA | 24,038,261 |
| 39 | C.W. Driver | 23,670,000 |
| 40 | James G. Davis Construction | 22,850,344 |
| 41 | Walbridge | 22,200,000 |
| 42 | Hill International | 21,000,000 |
| 43 | Tutor Perini Corp. | 20,562,786 |
| 44 | Bomel Construction | 19,179,585 |
| 45 | Kraus-Anderson Construction | 19,000,000 |
| 46 | Clune Construction | 17,825,626 |
| 47 | Austin Commercial | 17,584,385 |
| 48 | CORE Construction Group | 17,295,729 |
| 49 | Parsons Brinckerhoff | 16,431,889 |
| 50 | Hoffman Construction | 14,000,000 |
| 51 | LeChase Construction Services | 13,120,000 |
| 52 | Gilbane | 12,521,010 |
| 53 | IMC Construction | 12,332,000 |
| 54 | Kitchell Corp. | 11,602,544 |
| 55 | Suffolk Construction | 10,523,993 |
| 56 | McShane Companies, The | 6,599,886 |
| 57 | Manhattan Construction | 6,170,000 |
| 58 | Bernards | 4,700,000 |
| 59 | Adolfson & Peterson Construction | 3,534,704 |
| 60 | Robins & Morton | 3,351,771 |
| 61 | Batson-Cook | 2,741,450 |
| 62 | Stalco Construction | 2,310,600 |
| 63 | Bette Companies, The | 1,548,000 |
| 64 | Walsh Group, The | 1,485,547 |
| 65 | W. M. Jordan Company | 965,753 |
| 66 | Douglas Company, The | 772,135 |
| 67 | Allen & Shariff | 400,000 |
| 68 | Alberici Constructors | 156,054 |
Read full 2014 Giants 300 Report
Related Stories

| Nov 27, 2013
Wonder walls: 13 choices for the building envelope
BD+C editors present a roundup of the latest technologies and applications in exterior wall systems, from a tapered metal wall installation in Oklahoma to a textured precast concrete solution in North Carolina.

| Nov 27, 2013
University reconstruction projects: The 5 keys to success
This AIA CES Discovery course discusses the environmental, economic, and market pressures affecting facility planning for universities and colleges, and outlines current approaches to renovations for critical academic spaces.

| Nov 26, 2013
7 ways to make your firm more successful
Like all professional services businesses, AEC firms are challenged to effectively manage people. And even though people can be rather unpredictable, a firm’s success doesn’t have to be. Here are seven ways to make your firm more successful in the face of market variability and uncertainty.

| Nov 26, 2013
Design-build downsized: Applying the design-build method in an era of smaller projects
Any project can benefit from the collaborative spirit and cooperative relationships embodied by design-build. But is there a point of diminishing return where the design-build project delivery model just doesn't make sense for small projects? Design-build expert Lisa Cooley debates the issue.

| Nov 25, 2013
Electronic plan review: Coming soon to a city near you?
With all the effort AEC professionals put into leveraging technology to communicate digitally on projects, it is a shame that there is often one major road block that becomes the paper in their otherwise “paperless” project: the local city planning and permitting department.
| Nov 22, 2013
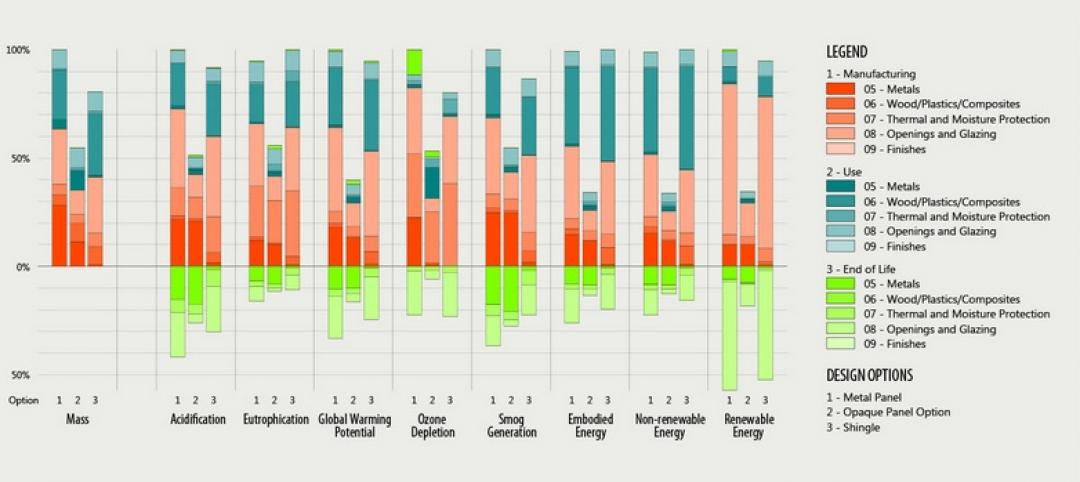
Kieran Timberlake, PE International develop BIM tool for green building life cycle assessment
Kieran Timberlake and PE International have developed Tally, an analysis tool to help BIM users keep better score of their projects’ complete environmental footprints.

| Nov 20, 2013
Architecture Billings Index slows in October; project inquiries stay strong
Following three months of accelerating demand for design services, the Architecture Billings Index reflected a somewhat slower pace of growth in October. The October ABI score was 51.6, down from a mark of 54.3 in September.
| Nov 19, 2013
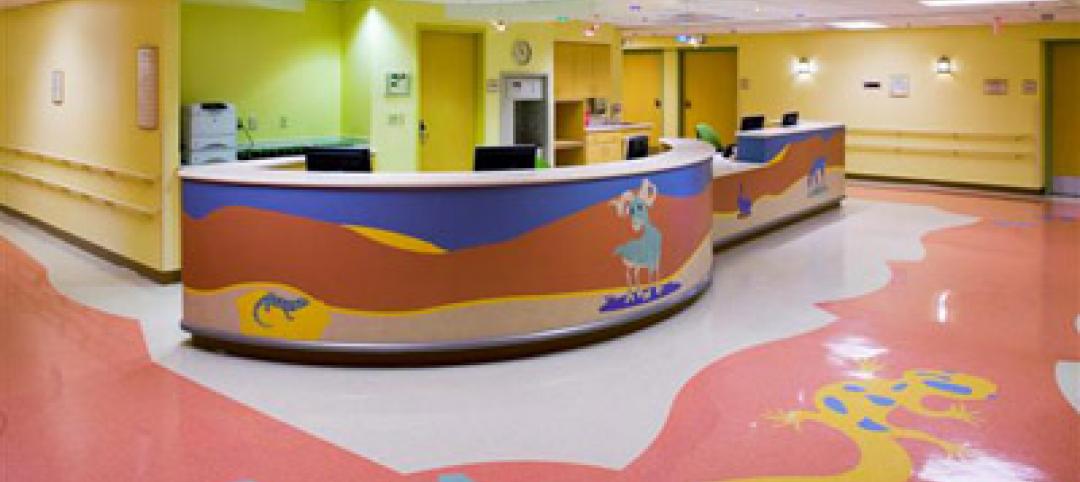
Pediatric design in an adult hospital setting
Freestanding pediatric facilities have operational and physical characteristics that differ from those of adult facilities.

| Nov 18, 2013
6 checkpoints when designing a pediatric healthcare unit
As more time and money is devoted to neonatal and pediatric research, evidence-based design is playing an increasingly crucial role in the development of healthcare facilities for children. Here are six important factors AEC firms should consider when designing pediatric healthcare facilities.

| Nov 18, 2013
Lord Aeck Sargent opens metro D.C. office, updates brand
Architecture, design, and planning firm unveils its sixth office, plus a new visual identity system and website


