


Pop quiz time: Of the total retail sales in 2013, what percentage came from online shopping?
Twenty-five percent? Nope, lower. Twenty percent? Not even close. Ten percent? Getting warmer.
Would you believe that, even with the e-commerce sector’s torrid pace of growth during the past decade, online sales represented just 6% of all retail business last year?
The gloom-and-doom scenario for bricks-and-mortar retail that is portrayed in the media is grossly overstated. It makes for good headlines, but it’s not based in fact, according to Jones Lang LaSalle’s latest retail sector outlook.
“Remember catalogs? Flipping through the pages, dialing up a call center, and placing an order? Web sales are really just replacing that,” said Kris Cooper, Managing Director, JLL Capital Markets. “People still need to see and touch things. The instant gratification of an in-store purchase can’t be discounted. Retailers who want to thrive will need to incorporate it all—hands-on goods, e-commerce, and mobile commerce.”
Giants 300 coverage of Retail brought to you by: C.R. Laurence www.crlaurence.com.
That’s not to say the retail sector doesn’t have its issues. There has been a spate of big-name store closings recently—including Coldwater Creek, Office Depot, and Radio Shack—and retailers continue to struggle to adjust to the structural changes occurring in their industry.
But, all in all, the U.S. retail sector is faring quite well, according to JLL, continuing its solid recovery and exhibiting tightening market conditions. The real estate group expects asking rents nationally to rise 2.7% this year, following 1.1% growth in 2013, and vacancy rates to drop more than 6% for the second straight year.
Net absorption was up a whopping 42% in 2013, to 83.2 million sf. With increased demand for retail space, landlords are starting to exert some power in tenant selection and lease terms, according to JLL.
Here are some highlights from the firm’s Spring 2014 Cross Sector Outlook (http://tinyurl.com/JLLCrossSectorOutlook):
• Power centers are experiencing the tightest overall market conditions, with a total vacancy rate of just 5.1%.
• Investment dollars are flowing into high-quality, grocery-anchored centers and trophy malls. “Demand for those asset types is incredible right now—if only we could convince all the owners to bring those to market,” said Margaret Caldwell, Managing Director, JLL Capital Markets.
• Construction growth will remain marginal during the next 12 months. New construction is focused primarily on single-tenant big-box and discount/wholesale space. Of the multi-tenant projects under construction, the majority are in urban cores and peripheral outlet centers.
• As the market continues to recover, the retail construction sector will eventually see an uptick in construction where tenants demand new space because supply is so constrained, where rents are high enough to justify construction, and where there are few barriers to new development, such as Orlando, Fla.
• Retail property transactions were strong in 2013. Sales of significant retail properties totaled more than $60.8 billion in 2013, up 8% from the previous year. Sales of strip centers and single-tenant properties fared even better, rising 26% year over year.
• There are strong opportunities for development in Sunbelt markets with higher-than-average population growth rates, including Charlotte, N.C., Orlando, and Raleigh, N.C.
SIGNS OF LIFE FOR SHOPPING CENTERS
For the first time since 2007, shopping center development in the U.S. increased year over year, according to Cushman & Wakefield’s new Global Shopping Center Development Report (http://tinyurl.com/CWreport). Nearly 400 shopping centers totaling more than 12.2 million sm of gross leasable area (GLA) were completed in 2013, an increase of 12.7% compared to the previous year.
In fact, the U.S. has accounted for roughly 18% of all new shopping center space delivered worldwide since 2008, according to the report. And there’s no slowdown in sight.
During the next three years, an additional 758 centers containing approximately 11.2 million sm of new GLA will be added to the U.S. inventory, two-thirds of which is expected to be completed in 2014 alone. Developments in California, Florida, and Texas will make up about a third of all new shopping center construction during this period, according to Cushman & Wakefield.
While the large malls get all the headlines—like the long-delayed, 274,000-sm American Dream Meadowlands development in East Rutherford, N.J., and the 149,000-sm Shops at Summerlin (Nev.) Centre—the vast majority of new construction projects are small shopping centers, between 5,000 sm and 20,000 sm, with the average project at 17,700 sm.
Top Retail Architecture Firms
| Rank | Company | 2013 Retail Revenue |
| 1 | Callison | $109,251,013 |
| 2 | Gensler | 105,979,349 |
| 3 | RTKL Associates | 66,018,000 |
| 4 | MulvannyG2 Architecture | 60,000,000 |
| 5 | Stantec | 57,434,454 |
| 6 | WD Partners | 44,000,000 |
| 7 | RSP Architects | 36,346,000 |
| 8 | Little | 27,786,704 |
| 9 | MBH Architects | 25,106,000 |
| 10 | FRCH Design Worldwide | 24,600,000 |
| 11 | P+R Architects | 19,191,791 |
| 12 | Architects Orange | 14,036,393 |
| 13 | CTA Architects Engineers | 14,020,991 |
| 14 | DLR Group | 13,900,000 |
| 15 | NORR | 12,997,934 |
| 16 | CASCO Diversified Corp. | 12,500,000 |
| 17 | Bergmann Associates | 12,416,000 |
| 18 | Nadel | 9,000,000 |
| 19 | Perkins Eastman | 7,750,000 |
| 20 | Ware Malcomb | 7,600,000 |
| 21 | HOK | 7,345,023 |
| 22 | Good Fulton & Farrell | 7,324,000 |
| 23 | LawKingdon Architecture | 7,250,000 |
| 24 | Cooper Carry | 4,000,988 |
| 25 | API | 3,800,000 |
| 26 | Massa Montalto Architects | 3,482,000 |
| 27 | Beyer Blinder Belle | 3,205,403 |
| 28 | RS&H | 2,450,000 |
| 29 | Smallwood, Reynolds, Stewart, Stewart & Associates | 2,391,617 |
| 30 | Vocon | 2,366,525 |
| 31 | Gresham, Smith and Partners | 2,299,000 |
| 32 | Cuningham Group Architecture | 2,166,411 |
| 33 | ai Design Group | 2,093,530 |
| 34 | Solomon Cordwell Buenz | 1,700,000 |
| 35 | LPA | 1,637,397 |
| 36 | BLTa | 1,302,000 |
| 37 | NBBJ | 1,285,000 |
| 38 | Kohn Pedersen Fox Associates | 1,280,000 |
| 39 | TK Architects | 1,155,876 |
| 40 | LS3P | 1,061,129 |
| 41 | Ratio Architects | 990,326 |
| 42 | Eppstein Uhen Architects | 954,480 |
| 43 | RDH Interests | 922,242 |
| 44 | Carrier Johnson + Culture | 702,235 |
| 45 | Environetics | 625,747 |
| 46 | Colkitt & Company | 600,000 |
| 47 | GBBN Architects | 558,000 |
| 48 | Harvard Jolly Architecture | 533,943 |
| 49 | VOA Associates | 521,057 |
| 50 | JRS Architect | 490,000 |
| 51 | WATG | Wimberly Interiors | 472,000 |
| 52 | SchenkelShultz Architecture | 453,000 |
| 53 | Nelson | 393,822 |
| 54 | Goodwyn Mills & Cawood | 378,423 |
| 55 | Wight & Company | 371,000 |
| 56 | Moody Nolan | 361,308 |
| 57 | PGAL | 350,300 |
| 58 | Parkhill, Smith & Cooper | 336,000 |
| 59 | Montroy Andersen DeMarco | 310,000 |
| 60 | Becker Morgan Group | 287,996 |
| 61 | PHX Architecture | 280,000 |
| 62 | Morris Architects | 260,000 |
| 63 | BRPH | 225,000 |
| 64 | Mithun | 210,000 |
| 65 | FitzGerald Associates Architects | 151,500 |
| 66 | Clark Nexsen | 143,328 |
| 67 | Commonwealth Architects | 141,268 |
| 68 | Baskervill | 115,284 |
| 69 | Skidmore, Owings & Merrill | 108,913 |
| 70 | Adache Group Architects | 100,000 |
| 71 | Corgan | 74,847 |
| 72 | Hnedak Bobo Group | 72,000 |
| 73 | Hoefer Wysocki Architecture | 70,000 |
| 74 | Niles Bolton Associates | 65,728 |
| 75 | ATA Beilharz Architects | 60,180 |
| 76 | Hensley Lamkin Rachel | 50,000 |
| 77 | KZF Design | 47,356 |
| 78 | Heery International | 45,840 |
| 79 | TEG Architects | 12,163 |
Top Retail Engineering Firms
| Rank | Company | 2013 Retail Revenue |
| 1 | Jacobs | $182,720,000 |
| 2 | AECOM Technology Corp. | 105,890,000 |
| 3 | Henderson Engineers | 43,369,857 |
| 4 | URS Corp. | 36,003,188 |
| 5 | Wiss, Janney, Elstner Associates | 19,090,000 |
| 6 | Parsons Brinckerhoff | 16,431,889 |
| 7 | Dewberry | 9,513,612 |
| 8 | Thornton Tomasetti | 8,339,454 |
| 9 | Wallace Engineering | 7,667,000 |
| 10 | KLH Engineers | 6,506,748 |
| 11 | Shive-Hattery | 6,232,480 |
| 12 | Arup | 5,674,014 |
| 13 | Dunham Associates | 5,500,000 |
| 14 | Highland Associates | 4,600,000 |
| 15 | Magnusson Klemencic Associates | 4,133,492 |
| 16 | Coffman Engineers | 3,992,285 |
| 17 | Hixson Architecture, Engineering, Interiors | 3,100,000 |
| 18 | Davis, Bowen & Friedel | 2,748,648 |
| 19 | Leidos | 2,520,000 |
| 20 | WSP Group | 2,270,000 |
| 21 | Fishbeck, Thompson, Carr & Huber | 2,200,000 |
| 22 | AKF Group | 2,140,000 |
| 23 | French & Parrello Associates | 1,985,000 |
| 24 | KJWW Engineering Consultants | 1,686,418 |
| 25 | RDK Engineers | 1,670,000 |
| 26 | Martin/Martin | 1,614,144 |
| 27 | Interface Engineering | 1,573,325 |
| 28 | Simpson Gumpertz & Heger | 1,570,000 |
| 29 | Aon Fire Protection Engineering Corp. | 1,500,000 |
| 30 | CTLGroup | 1,450,000 |
| 31 | SSOE Group | 1,423,552 |
| 32 | Graef | 1,189,813 |
| 33 | Bala Consulting Engineers | 1,051,000 |
| 34 | M-E Engineers | 1,000,000 |
| 35 | Heapy Engineering | 969,445 |
| 36 | Wick Fisher White | 893,105 |
| 37 | OLA Consulting Engineers | 888,800 |
| 38 | Walter P Moore and Associates | 847,312 |
| 39 | TTG | 732,500 |
| 40 | DeSimone Consulting Engineers | 691,425 |
| 41 | H.F. Lenz | 652,000 |
| 42 | Paulus, Sokolowski and Sartor | 650,000 |
| 43 | I. C. Thomasson Associates | 600,000 |
| 44 | Vanderweil Engineers | 576,000 |
| 45 | Stanley Consultants | 447,960 |
| 46 | Zak Companies | 422,811 |
| 47 | Glumac | 421,563 |
| 48 | Allen & Shariff | 400,000 |
| 49 | KCI Technologies | 400,000 |
| 50 | Spectrum Engineers | 345,820 |
| 51 | TLC Engineering for Architecture | 342,071 |
| 52 | G&W Engineering Corp. | 217,100 |
| 53 | Sparling | 204,890 |
| 54 | Total Building Commissioning | 125,702 |
| 55 | Apogee Consulting Group | 115,325 |
| 56 | Barge Waggoner Sumner & Cannon | 100,000 |
| 57 | Brinjac Engineering | 80,270 |
| 58 | GHT Limited | 75,000 |
Top Retail Construction Firms
| Rank | Company | 2013 Retail Revenue |
| 1 | PCL Construction | $517,371,436 |
| 2 | Whiting-Turner Contracting Co., The | 479,057,948 |
| 3 | Shawmut Design and Construction | 386,000,000 |
| 4 | EMJ Corp. | 317,000,000 |
| 5 | Turner Construction | 236,380,000 |
| 6 | Balfour Beatty US | 195,847,685 |
| 7 | Lend Lease | 150,997,000 |
| 8 | Yates Companies, The | 122,000,000 |
| 9 | Hawkins Construction | 98,500,000 |
| 10 | Gray Construction | 97,770,000 |
| 11 | O'Neil Industries/W.E. O'Neil | 93,703,312 |
| 12 | Beck Group, The | 81,576,752 |
| 13 | Power Construction | 78,000,000 |
| 14 | S. M. Wilson & Co. | 72,877,695 |
| 15 | E.W. Howell | 71,900,000 |
| 16 | Structure Tone | 71,080,000 |
| 17 | DPR Construction | 70,199,893 |
| 18 | Choate Construction | 68,627,625 |
| 19 | KBE Building Corp. | 68,022,822 |
| 20 | Ryan Companies US | 67,191,615 |
| 21 | Weitz Company, The | 64,819,854 |
| 22 | Pepper Construction | 62,870,000 |
| 23 | JE Dunn Construction | 62,738,348 |
| 24 | Graycor | 59,864,863 |
| 25 | Hoar Construction | 53,500,000 |
| 26 | Hill & Wilkinson | 51,935,000 |
| 27 | McCarthy Holdings | 50,650,000 |
| 28 | Management Resource Systems | 45,255,861 |
| 29 | Leopardo Companies | 39,729,783 |
| 30 | Weis Builders | 37,993,000 |
| 31 | URS Corp. | 36,003,188 |
| 32 | Layton Construction | 35,900,000 |
| 33 | Clark Group | 35,131,316 |
| 34 | Brasfield & Gorrie | 33,249,173 |
| 35 | EBCO General Contractor | 33,134,000 |
| 36 | JLL | 30,323,117 |
| 37 | Paric Corp. | 25,000,000 |
| 38 | Skanska USA | 24,038,261 |
| 39 | C.W. Driver | 23,670,000 |
| 40 | James G. Davis Construction | 22,850,344 |
| 41 | Walbridge | 22,200,000 |
| 42 | Hill International | 21,000,000 |
| 43 | Tutor Perini Corp. | 20,562,786 |
| 44 | Bomel Construction | 19,179,585 |
| 45 | Kraus-Anderson Construction | 19,000,000 |
| 46 | Clune Construction | 17,825,626 |
| 47 | Austin Commercial | 17,584,385 |
| 48 | CORE Construction Group | 17,295,729 |
| 49 | Parsons Brinckerhoff | 16,431,889 |
| 50 | Hoffman Construction | 14,000,000 |
| 51 | LeChase Construction Services | 13,120,000 |
| 52 | Gilbane | 12,521,010 |
| 53 | IMC Construction | 12,332,000 |
| 54 | Kitchell Corp. | 11,602,544 |
| 55 | Suffolk Construction | 10,523,993 |
| 56 | McShane Companies, The | 6,599,886 |
| 57 | Manhattan Construction | 6,170,000 |
| 58 | Bernards | 4,700,000 |
| 59 | Adolfson & Peterson Construction | 3,534,704 |
| 60 | Robins & Morton | 3,351,771 |
| 61 | Batson-Cook | 2,741,450 |
| 62 | Stalco Construction | 2,310,600 |
| 63 | Bette Companies, The | 1,548,000 |
| 64 | Walsh Group, The | 1,485,547 |
| 65 | W. M. Jordan Company | 965,753 |
| 66 | Douglas Company, The | 772,135 |
| 67 | Allen & Shariff | 400,000 |
| 68 | Alberici Constructors | 156,054 |
Read full 2014 Giants 300 Report
Related Stories

| Dec 20, 2013
Must see for the holidays: Architects re-create iconic structures using gingerbread
Gensler, PBK, Page Sutherland Page, and Kirksey were among the firms to compete in the 5th Annual Gingerbread Build-Off.
| Dec 20, 2013
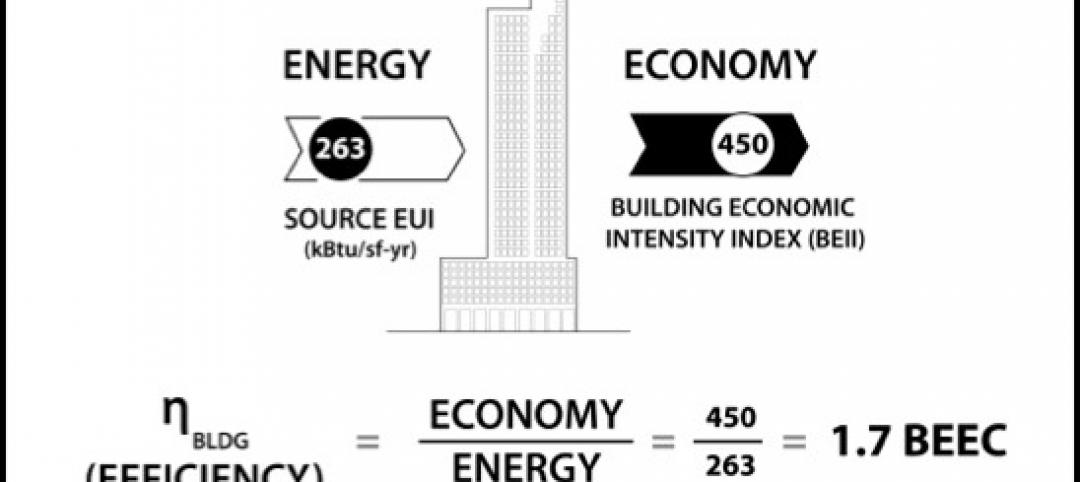
Can energy hogs still be considered efficient buildings? Yes, say engineers at Buro Happold
A new tool from the engineering firm Buro Happold takes into account both energy and economic performance of buildings for a true measure of efficiency.

| Dec 18, 2013
How small architectural firms can make big money
What separates the great-but-struggling designers from the great-successful ones isn't luck. If you're as good an architect as you think, it will take more than your awesome design skills to become successful. Learn how to manage your firm’s finances and go from floundering to flourishing.

| Dec 18, 2013
Eskew + Dumez + Ripple receives AIA's 2014 Architecture Firm Award
The American Institute of Architects (AIA) Board of Directors has voted for Eskew + Dumez + Ripple to receive the 2014 AIA Architecture Firm Award. The firm will be honored at the 2014 AIA National Convention in Chicago. The Board also voted to posthumously honor Julia Morgan, FAIA, with its 214 Gold Medal.

| Dec 18, 2013
Architecture Billings Index takes step back in November
After six months of steadily increasing demand for design services, the Architecture Billings Index paused in November, dipping below 50 for just the second time in 2013.

| Dec 17, 2013
Kahn appoints Alan Cobb President and CEO
Cobb is the tenth president in the firm’s 118-year history. As President, Cobb is responsible for ensuring that all of the firm’s client issues are effectively address and that overall project team performance meets or exceeds client expectations for each and job the firm undertakes.
| Dec 17, 2013
CBRE's Chris Bodnar and Lee Asher named Healthcare Real Estate Executives of the Year
CBRE Group, Inc. announced today that two of its senior executives, Chris Bodnar and Lee Asher, have been named Healthcare Real Estate Executives of the Year by Healthcare Real Estate Insights.
| Dec 16, 2013
Is the metal building industry in a technology shift?
Automation is the future you can’t avoid, though you may try. Even within the metal building industry—which is made up of skilled tradesmen—automation has revolutionized, and will continue revolutionizing, how we work.

| Dec 16, 2013
Why employees don’t trust their leaders
Trust, one of the key elements to productive business relationships, is in short supply these days. An Associated Press-GfK poll discovered that only one-third of Americans say most people can be trusted and nearly two-thirds says “you can’t be too careful” in dealing with people.

| Dec 16, 2013
Construction materials prices remain stable in November
Overall, construction materials prices fell 0.5 percent in November and are up only 1.1 percent year over year, according to the Department of Labor’s Dec. 13 Producer Price Index.


